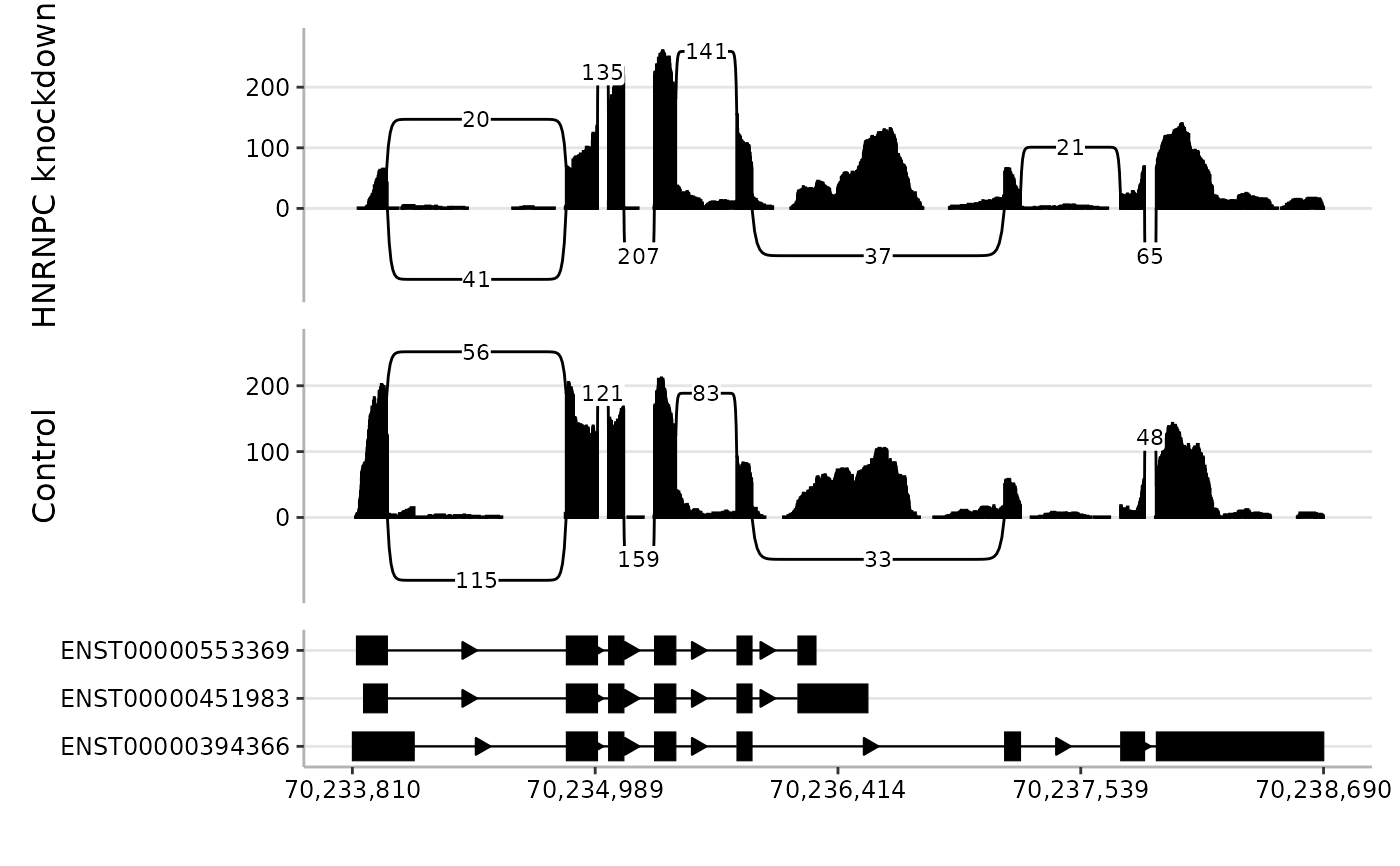
Visualise RNA-seq alignments as sashimi-style plots
Source:R/spliceTerrain.R
spliceTerrain-methods.RdspliceTerrain() draws sashimi-style plots for one or more BAM files
over a genomic region. Plots combine per-base fragment coverage, splice
junction arcs, optional transcript annotation, and highlighted regions.
Intronic or otherwise uninformative gaps can be compacted so the plotting
area is focused on observed or annotated features.
Usage
spliceTerrain(
  bam,
  region,
  annotation = NULL,
  junction_usage = NULL,
  junction_usage_label_sep = "\n",
  highlight = NULL,
  strandedness = "unstranded",
  min_mapq = 0,
  min_coverage = 0,
  min_junction_reads = 10,
  lib_size = NULL,
  norm_factors = NULL,
  normalise_to = NULL,
  compress_introns = TRUE,
  intron_width = 50,
  min_arrow = intron_width + 1,
  common_y = FALSE,
  arc_height = 1,
  arc_side = c("both", "above", "below"),
  arc_scale = FALSE,
  colours = "black",
  highlight_colour = scales::alpha("red", 0.2),
  anno_fill_by = NULL,
  anno_fill_colours = NULL,
  anno_label_by = NULL,
  anno_label_colour = "white",
  anno_label_size = 3,
  junc_text_size = 3,
  panel_heights = 1,
  axis_title_size = 12,
  axis_text_size = 9,
  return_ctx = FALSE,
  ctx = NULL,
  annotated_junctions = FALSE
)
Arguments
- bam
Character vector of BAM file paths. If unnamed, sample labels are derived from BAM basenames with the
.bamsuffix removed. If names are supplied, all names must be non-empty and unique. BAM files must be indexed for region-restricted import. Index files should be discoverable by Rsamtools using standard same-directory naming, such asfile.bam.bai. Single-end and paired-end BAMs are both supported; paired-end status is detected from the BAM flags. For paired-end BAMs, mapped reads are retained even when their mates are unmapped.- region
Genomic interval to plot. May be a GRanges, a GRangesList, or a character string coercible to
GRanges, such as"chr:start-end"or"chr:start-end:strand". Commas, spaces, and en/em dashes in character regions are normalised before coercion. If multiple ranges are supplied, they must all be on the same seqname and are reduced to a single span used as the BAM query and plotting window. SuppliedSeqinfometadata is preserved. Use consistent genome assembly identifiers and sequence lengths for the region, annotation, and overlays; known metadata conflicts are rejected by the overlap operations.- annotation
Optional annotation track. Must be a GRangesList, with each list element representing one feature group such as a transcript model. Each group is drawn on its own annotation row. List element names are used as y-axis labels; if absent, default group labels are generated. Supplied names must be non-empty and unique. Annotation groups are retained in full when they overlap the plotting region and are clipped to the plotting window when drawn. All ranges in a retained group must be on the plotting seqname and share one strand.
- junction_usage
Optional genomic interval(s) selecting junctions for local usage percentages. Accepts the same formats as
region. Junctions with either anchor overlapping the interval(s) are selected. Each percentage is that junction's fraction of summed fragment support among all selected, eligible imported junctions in its sample, before display filtering or clipping. A single shared splice site gives the clearest interpretation; a range can combine multiple sites. This is not an event-level percent-spliced-in estimate. Anchors are the first and last intronic bases.- junction_usage_label_sep
Character scalar inserted between junction counts and percentages when
junction_usageis supplied. Defaults to"\n"; use" "to keep percentages inline with counts.- highlight
Optional interval(s) to highlight. Accepts the same formats as
region. Multiple ranges may be supplied. Highlighted intervals are drawn as shaded vertical bands spanning the full panel height. Only the portion overlapping the plotting window is drawn. Returned contexts keep the full retained genomic intervals inhighlight.- strandedness
Library strandedness for each BAM. Must be one of
"unstranded","forward", or"reverse", and may be supplied either as a single value applied to all BAMs or as one value per BAM. Use"unstranded"when reads from both strands should be included. For stranded paired-end BAMs, this value is passed to readGAlignmentsList asstrandMode, which uses the read-one/read-two flags for both complete pairs and singletons. Ifregionincludes a strand andstrandednessis not"unstranded", imported alignments are restricted to overlaps on the resolved region strand.- min_mapq
Integer scalar. Minimum mapping quality (MAPQ) for alignments to be imported from the BAM file.
- min_coverage
Integer or percentage string. Minimum per-base fragment coverage required for positions to be retained for plotting. Percentage strings such as
"10%"are relative to the maximum coverage within the plotting region for each BAM. May be supplied as a single value for all BAMs or as one value per BAM. Per-BAM character vectors may combine whole-number counts and percentage strings.- min_junction_reads
Integer or percentage string. Minimum number of fragments supporting a junction for it to be retained for plotting. Both mates supporting the same junction contribute one count. Percentage strings such as
"10%"are relative to the most-supported junction within the plotting region for each BAM. May be supplied either as a single value applied to all BAMs or as one value per BAM. Per-BAM character vectors may combine whole-number counts and percentage strings.- lib_size
Optional numeric vector giving full-library sizes in fragment units, one per BAM file, before restriction to the plotting region. A pair or mapped singleton is one fragment; for single-end libraries, each mapped read is one fragment. When supplied, coverage and junction counts are normalised by effective library size before plotting.
- norm_factors
Optional numeric vector of normalisation factors, one per BAM file, such as edgeR TMM normalisation factors. Requires
lib_size. Effective library sizes are calculated aslib_size * norm_factors.- normalise_to
Optional numeric scalar giving the target library size used for normalisation. If
NULL, counts are normalised to the median effective library size.- compress_introns
Logical scalar. If
TRUE, compact gaps between observed or annotated genomic blocks so plotting space is focused on regions containing coverage, junctions, annotations, or supplied overlays. IfFALSE, plot genomic coordinates directly.- intron_width
Integer scalar. Approximate plot-space width used for compacted gaps when
compress_introns = TRUE.- min_arrow
Integer scalar. Minimum annotation intron width required before drawing directional arrows.
- common_y
Logical scalar. If
TRUE, use a common y-axis range across all sample panels. IfFALSE, each sample panel is scaled independently.- arc_height
Numeric scalar multiplying the default junction arc height.
arc_height = 1uses the default height of 0.15 times the coverage scale; larger values produce taller arcs and greater separation between stacked arcs.- arc_side
Character scalar controlling where junction arcs are drawn. Must be one of
"both","above", or"below". The default"both"alternates arcs above and below the coverage track in genomic sort order.- arc_scale
Logical scalar. If
TRUE, scale junction arc line width by junction fragment count after filtering. IfFALSE, use a constant line width for all junction arcs.- colours
Character vector of colours used for each sample's coverage bars and junction arcs. Must be either length 1, in which case the same colour is used for all BAMs, or the same length as
bam, in which case one colour is used per sample.- highlight_colour
Fill and border colour used for highlighted regions. The default is a semi-transparent red produced with
scales::alpha("red", 0.2).- anno_fill_by
Optional character scalar naming a metadata column in
annotationused to group annotation features for fill colouring. Use"group"to colour by transcript/group. Values in this column are treated as discrete groups, not as continuous values or literal colour names or hex codes.- anno_fill_colours
Optional vector of colours used when
anno_fill_byis supplied. Use this argument to set annotation fill colours. If named, names should match values in the selected fill column.- anno_label_by
Optional character scalar naming a metadata column in
annotationto display as text within annotation features.- anno_label_colour
Character scalar giving the colour used for annotation labels.
- anno_label_size
Numeric scalar giving the text size used for annotation labels.
- junc_text_size
Numeric scalar giving the size of junction count labels. Passed to
ggplot2::geom_label()for junction annotations.- panel_heights
Numeric vector controlling relative heights of the plot panels. Must be length 1 or the number of BAM sample panels plus one additional value if an annotation panel is shown. When an annotation panel is shown, its height is specified by the final value.
- axis_title_size
Numeric scalar giving the axis title text size used in the final plot theme.
- axis_text_size
Numeric scalar giving the axis tick-label text size used in the final plot theme.
- return_ctx
Logical scalar. If
FALSE, return the assembled sashimi plot. IfTRUE, return the processed context list after BAM import, coverage and junction summarisation, and filtering, but before coordinate mapping or plot assembly. Coordinate-bearing fields in the returned context use genomic coordinates.- ctx
Optional context list previously returned by
spliceTerrain(..., return_ctx = TRUE). When supplied, BAM import, summarisation, and filtering are skipped. Plot-space coordinates are rebuilt from the context's genomic data before drawing the plot. No other arguments may be supplied withctx; plotting options can instead be modified in the context itself.- annotated_junctions
Logical scalar. If
TRUE, junctions that exactly match an intron implied byannotationare drawn with solid arcs and unmatched junctions are drawn with dashed arcs. Matching uses seqname, start, and end coordinates and ignores strand. Requiresannotation.
Value
If return_ctx = FALSE, a patchwork object containing one sample
panel per BAM file plus an optional annotation panel.
If return_ctx = TRUE, a named list containing validated settings and
processed alignment, coverage, junction, annotation, and overlay data. All
coordinate-bearing fields use genomic coordinates; plot-space data are
generated internally when the context is plotted.
The gal field contains one alignment object per BAM: a
GAlignments for single-end input or a
GAlignmentsList for paired-end input.
Paired-end list elements group the imported mates and include mapped
singleton reads.
The cov and juncs fields store fragment summaries. Their
coverage_raw columns contain unnormalised fragment counts, while
coverage contains the values used for plotting, normalised when
lib_size is supplied. The gal field retains the imported
alignments rather than collapsed coverage or junction data.
juncs_all stores the unfiltered junction reference. The
usage_fraction column in juncs contains fractions on the 0–1
scale; NA denotes an unselected junction or undefined percentage.
Fractions are recalculated from juncs_all before each plot is drawn.
In the returned plot, the x-axis is shared across panels. Tick labels are shown in genome coordinates, including when introns are compressed.
Details
The plot is built in three conceptual steps:
Alignments overlapping
regionare imported from each BAM file. Unmapped, secondary, and supplementary alignments are ignored, andmin_mapqis applied during import.Fragment coverage and splice junction support are summarised from the imported alignments and filtered by
min_coverageandmin_junction_reads.If
compress_introns = TRUE, a plot-space map is constructed to compact gaps between observed or annotated genomic blocks. Coverage, junctions, annotation, and optional overlays are then mapped into this compacted coordinate system.
For BAMs detected as paired-end, alignments flagged as paired are imported as groups containing complete pairs or mapped singletons. A mapped read does not require a mapped mate to contribute to the plot. Each imported group is treated as one fragment. For single-end input, each read is one fragment. Coverage uses the union of each fragment's aligned blocks. Overlapping mates contribute at most one count per position. Introns and unsequenced gaps between mates are not filled. Each fragment contributes at most one count per distinct junction, even when both mates cross it; a fragment can support multiple different junctions. Independent fragments are counted separately, including those with identical coordinates. This is not PCR/UMI deduplication. Retaining singletons avoids losing their signal when mate-mapping success differs between samples.
region, junction_usage, and highlight may be supplied as
genomic ranges or as strings coercible to GRanges. If multiple
ranges are supplied for region, they must all be on the same seqname;
their span is used as the BAM query and plotting window. Optional genomic
overlays are retained when they overlap the plotting region and are clipped
to the plotting window when drawn.
junction_usage and highlight are optional selections:
junction_usageselects junctions by their intronic anchors. Percentages use raw fragment support after import/MAPQ/strand filtering, beforemin_junction_readsfiltering and plotting-window exclusion. Hidden junctions remain in the denominator, so visible percentages need not sum to 100. A junction is counted once in the denominator even when both anchors or multiple selection intervals match it. Different junctions from one fragment each contribute their support; these are junction fractions, not fractions of unique molecules across the whole selection.highlightmarks one or more genomic intervals to draw attention to a subregion, such as an exon, splice site, or event.
Usage percentages are computed separately for each sample and are unchanged by library-size normalisation or coordinate compression. Labels are rounded to one decimal place. If no selected junction has positive support, no usage percentage is shown. The denominator is conditional on the imported data: changing the BAM query region, MAPQ threshold, or strand selection can change which evidence is available.
The arguments strandedness, min_coverage,
min_junction_reads, and colours may each be supplied either as
length 1, in which case the value is recycled across all BAMs, or as one
value per BAM.
When lib_size is supplied, coverage and junction counts are normalised
to a common effective library size before plotting. Effective library sizes
are calculated as lib_size * norm_factors, with
norm_factors = 1 when not supplied. If normalise_to = NULL,
counts are normalised to the median effective library size. Filtering
thresholds min_coverage and min_junction_reads are always
applied to raw counts before normalisation. Percentage thresholds are
calculated separately for each BAM from the maximum raw value within the
plotting region.
Strand filtering is applied after BAM import. Unstranded libraries retain
alignments from both strands. For stranded libraries, reads are interpreted
according to strandedness; when the resolved region has a
specific strand, alignments are then restricted to that strand.
When compress_introns = TRUE, the plot uses compacted coordinates
internally, but x-axis tick labels are reported as approximate genomic
coordinates.
Annotation is drawn on a separate panel beneath the sample panels. Highlighted intervals are overlaid across both sample and annotation panels when present.
For advanced workflows, return_ctx = TRUE can be used to inspect or
modify processed genomic data before plotting. The returned context is a
named list containing genomic summaries and plotting settings. Fields such as
cov, juncs, juncs_all, annotation,
junction_usage, and highlight all use genomic coordinates.
Passing the modified context through ctx rebuilds the coordinate map
and redraws the plot without reading the BAM files again.
Coverage and junctions in a returned context have already been summarised,
filtered, and normalised. Changing processing settings such as
min_mapq, min_coverage, min_junction_reads, or
lib_size does not repeat those processing steps; modify
ctx$cov or ctx$juncs directly instead. Plotting settings such
as colours, arc_side, and compress_introns may be
changed in the context before replotting.
juncs_all retains the eligible junction summaries on the plotting
chromosome before display filtering or clipping, including junctions outside
the plotting window. It is the reference for usage calculations when a
context is replotted. Filtering ctx$juncs changes only the display;
modify ctx$juncs_all if you intend to change the usage reference.
The reference must retain one row per sample/junction and its non-negative
coverage_raw counts. Changing ctx$junction_usage to another
GRanges selection recalculates percentages from this reference.
The replacement selection must overlap the plotting region and have
compatible genomic metadata.
References
Katz Y et al. (2015). Quantitative visualization of alternative exon expression from RNA-seq data. Bioinformatics, 31(14), 2400–2402. doi:10.1093/bioinformatics/btv034 .
Robinson MD and Oshlack A (2010). A scaling normalization method for differential expression analysis of RNA-seq data. Genome Biology, 11, R25. doi:10.1186/gb-2010-11-3-r25 .
Zarnack K et al. (2013). Direct Competition between hnRNP C and U2AF65 Protects the Transcriptome from the Exonization of Alu Elements. Cell, 152(3), 453–466. doi:10.1016/j.cell.2012.12.023 .
See also
readGAlignments and readGAlignmentsList for reading alignments, and GRanges for representing genomic intervals.
Examples
if (
  requireNamespace("RNAseqData.HNRNPC.bam.chr14", quietly = TRUE) &&
  requireNamespace("EnsDb.Hsapiens.v75", quietly = TRUE) &&
  requireNamespace("AnnotationFilter", quietly = TRUE) &&
  requireNamespace("ensembldb", quietly = TRUE)
) {
  bams <- RNAseqData.HNRNPC.bam.chr14::RNAseqData.HNRNPC.bam.chr14_BAMFILES
  bams <- bams[c(7, 1)]
  names(bams) <- c("HNRNPC knockdown", "Control")
  region <- "chr14:70,233,810-70,238,690"

  annotation <- ensembldb::exonsBy(
    EnsDb.Hsapiens.v75::EnsDb.Hsapiens.v75,
    by = "tx",
    filter = AnnotationFilter::GeneIdFilter("ENSG00000100650")
  )
  annotation <- annotation[1:3]
  ensembldb::seqlevelsStyle(annotation) <- "ucsc"

  spliceTerrain(bam = bams, region = region)

  spliceTerrain(
    bam = bams,
    region = region,
    lib_size = c(40e6, 55e6),
    norm_factors = c(0.95, 1.08),
    common_y = TRUE
  )

  spliceTerrain(
    bam = bams,
    region = region,
    annotation = annotation,
    anno_fill_by = "group",
    anno_fill_colours = c(
        ENST00000553369 = "#66C2A5",
        ENST00000394366 = "#8DA0CB",
        ENST00000451983 = "#FC8D62"
    ),
    anno_label_by = "exon_rank",
    anno_label_colour = "black",
    junction_usage = "chr14:70234854-70234854",
    highlight = "chr14:70233810-70234097",
    arc_height = 2,
    arc_side = "above",
    arc_scale = TRUE,
    common_y = TRUE,
    colours = c("darkblue", "darkred"),
    highlight_colour = scales::alpha("gold", 0.25),
    anno_label_size = 2,
    panel_heights = c(2, 2, 1)
  )

  ctx <- spliceTerrain(
    bam = bams,
    region = region,
    annotation = annotation,
    min_junction_reads = 1,
    panel_heights = c(2, 2, 1),
    return_ctx = TRUE
  )
  ctx$juncs <- ctx$juncs[ctx$juncs$coverage >= 20]
  spliceTerrain(ctx = ctx)
}