
Creating Sashimi-Style Plots with `spliceTerrain`
Lachlan Baer
Robinson Research Institute, Adelaide University, Adelaide, SA, AustraliaCollege of Health, Adelaide University, Adelaide, SA, Australiabioc@lwwb.dev
Last modified: 2026-11-05
Source:vignettes/spliceTerrain.Rmd
spliceTerrain.RmdInstallation and setup
BiocManager is recommended for installing the packages
required in this vignette. BiocManager handles installation
from Bioconductor, CRAN and GitHub repositories.
if (!"BiocManager" %in% rownames(installed.packages()))
    install.packages("BiocManager")
pkgs <- c(
    "spliceTerrain", "RNAseqData.HNRNPC.bam.chr14", "EnsDb.Hsapiens.v75",
    "AnnotationFilter", "ensembldb", "GenomicRanges", "scales", "pander",
    "GenomeInfoDb"
)
BiocManager::install(pkgs, update = FALSE)
library(spliceTerrain)
library(RNAseqData.HNRNPC.bam.chr14)
library(EnsDb.Hsapiens.v75)
library(AnnotationFilter)
library(ensembldb)
library(GenomicRanges)
library(scales)
library(pander)
library(GenomeInfoDb)
Quick start
At a minimum, spliceTerrain() needs BAM file paths and a
genomic interval. Here we use BAM files from
RNAseqData.HNRNPC.bam.chr14, selecting one HNRNPC knockdown
sample and one control sample from the study by Zarnack et al. (Zarnack et al. 2013) (ArrayExpress accession
E-MTAB-1147). The region can be supplied as a single character
string.
bams <- RNAseqData.HNRNPC.bam.chr14_BAMFILES[c(7, 1)]
region <- "chr14:70,233,810-70,238,690"

spliceTerrain(bam = bams, region = region)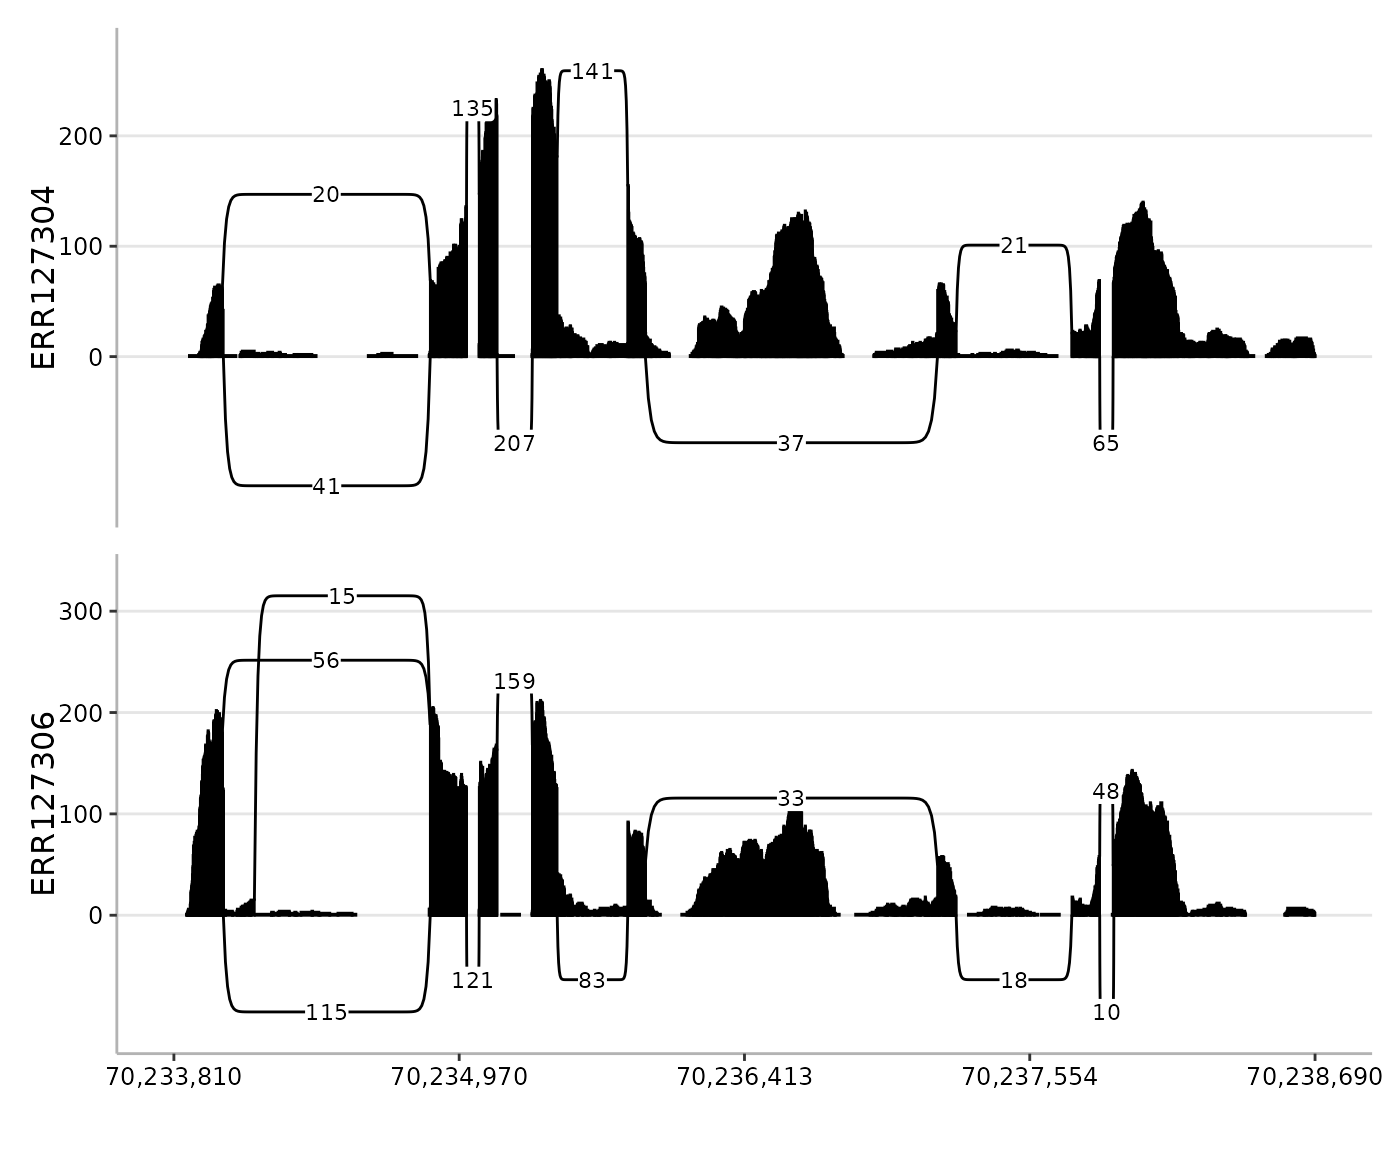
Introduction
Sashimi plots visualise RNA-seq alignments across a genomic interval.
They combine coverage tracks with arcs representing splice junction
support (Katz et al. 2015).
spliceTerrain reports both coverage and junction support in
fragment-level units. This makes them useful for inspecting transcript
structure, exon usage, alternative splice sites, intron retention, and
differences in junction usage between samples.
Motivation
spliceTerrain was designed to fit into R/Bioconductor
workflows. Candidate regions, exon models, and features of interest are
often already represented as GRanges or
GRangesList objects from GenomicRanges (Lawrence et al. 2013).
spliceTerrain allows reuse of these objects for regions,
transcript annotation, and highlights alongside indexed BAM files,
within the same R session. For example, exon models retrieved from an
EnsDb object can become annotation rows without first
exporting them to an annotation file.
spliceTerrain brings these inputs together in a focused,
sample-resolved sashimi workflow. It returns a patchwork
plot or an inspectable genomic context. Its genomic summaries and
plotting settings can be edited and replotted.
spliceTerrain displays one panel per BAM for visual
inspection of local splicing patterns. It does not perform
differential-splicing testing, estimate event-level PSI, or infer
transcript isoforms.
Related tools
Several established tools support related visualisation tasks:
-
Gvizprovides genomic tracks, including BAM-backed coverage and sashimi plots (Hahne and Ivanek 2016). -
ggbioprovides genomic visualisation based onggplot2, with support for Bioconductor objects and transcript-based splice summaries (Yin et al. 2012). -
SpliceWizprovides coverage and sashimi plots within an alternative-splicing analysis workflow. Its event-normalised coverage plots offer an alternative view of splicing differences, summarising replicates by condition rather than relying on individual-sample sashimi plots (Wong et al. 2024). -
ggsashimiprovides a command-line sashimi plotting workflow with sample overlays and aggregation (Garrido-Martín et al. 2018).
spliceTerrain focuses on sample-resolved sashimi plots
within R/Bioconductor workflows. It is particularly useful when regions
and annotations are already represented as genomic objects and plots
need iterative refinement. It combines:
- Editable genomic summaries: inspect or modify coverage, junctions, and settings in a returned context, then replot without importing the BAM files again.
- Coverage-aware compression: preserve selected blocks defined by coverage, annotation, and junction anchors while shortening gaps. Coverage retained after filtering can preserve regions within annotated introns at their original width.
- Fragment-level support: count overlapping mates once per covered base and once per distinct junction, while retaining mapped singletons.
- Stable local junction fractions: calculate usage against the pre-display junction reference, so hiding arcs does not change the remaining percentages.
- Integrated sample normalisation: apply supplied library sizes and optional normalisation factors consistently to coverage and junction support, while retaining raw fragment counts for filtering.
These choices offer specific contrasts with existing workflows. When
compression is enabled, ggsashimi uses junction-derived,
length-dependent shrinking, whereas spliceTerrain also uses
retained coverage and annotation to define preserved blocks. By default,
Gviz and ggsashimi count support at the read
level, so both mates can contribute to coverage and junction counts. In
contrast, spliceTerrain uses fragment-level counts.
spliceTerrain displays transcript annotation alongside
observed junction support without assigning that support to transcript
models. This complements the transcript-model-based summaries provided
by ggbio’s plotSpliceSum().
spliceTerrain exposes sample normalisation through
dedicated arguments. Gviz supports custom transformations
that can implement similar scaling, whereas the ggsashimi
command-line interface has no equivalent library-size normalisation
option.
Versions compared: Gviz
1.57.4, ggbio
1.61.0, SpliceWiz
1.15.0, and ggsashimi
1.1.5.
Complete guide
The following sections build up aspects of a more complete plot and
introduce the main options available in spliceTerrain().
The examples continue to use the HNRNPC chr14 BAM files from the quick
start.
Input BAM files and regions
The bam argument is a character vector of indexed BAM
file paths. If the vector is named, those names are used as sample
labels in the plot. If it is unnamed, labels are derived from the BAM
file names. BAM files must be indexed for region-restricted import.
Index files should be discoverable by Rsamtools using
standard same-directory naming, typically file.bam.bai.
bams <- RNAseqData.HNRNPC.bam.chr14_BAMFILES[c(7, 1)]
names(bams) <- c("HNRNPC knockdown", "Control")
The region argument can be a character string, a
GRanges, or a GRangesList. Character regions
may use comma-separated coordinates, such as
"chr14:70,233,810-70,238,690". For Bioconductor workflows,
using a GRanges object is often more convenient.
Because the example BAM files use UCSC style chromosome names, we also convert the region to UCSC style before plotting.
ensDb <- EnsDb.Hsapiens.v75
region <- transcripts(ensDb, filter = TxIdFilter("ENST00000394366"))
seqlevelsStyle(region) <- "UCSC"
region
#> GRanges object with 1 range and 6 metadata columns:
#>                   seqnames            ranges strand |           tx_id     tx_biotype tx_cds_seq_start tx_cds_seq_end         gene_id         tx_name
#>                      <Rle>         <IRanges>  <Rle> |     <character>    <character>        <integer>      <integer>     <character>     <character>
#>   ENST00000394366    chr14 70233810-70238690      + | ENST00000394366 protein_coding         70234874       70238178 ENSG00000100650 ENST00000394366
#>   -------
#>   seqinfo: 1 sequence from hg19 genome
If multiple ranges are supplied, spliceTerrain() reduces
them to a single span on one chromosome and uses that span as the BAM
query and plotting window. The span is the smallest continuous interval
containing all supplied ranges: it starts at the lowest start coordinate
and ends at the highest end coordinate.
Adding transcript annotation
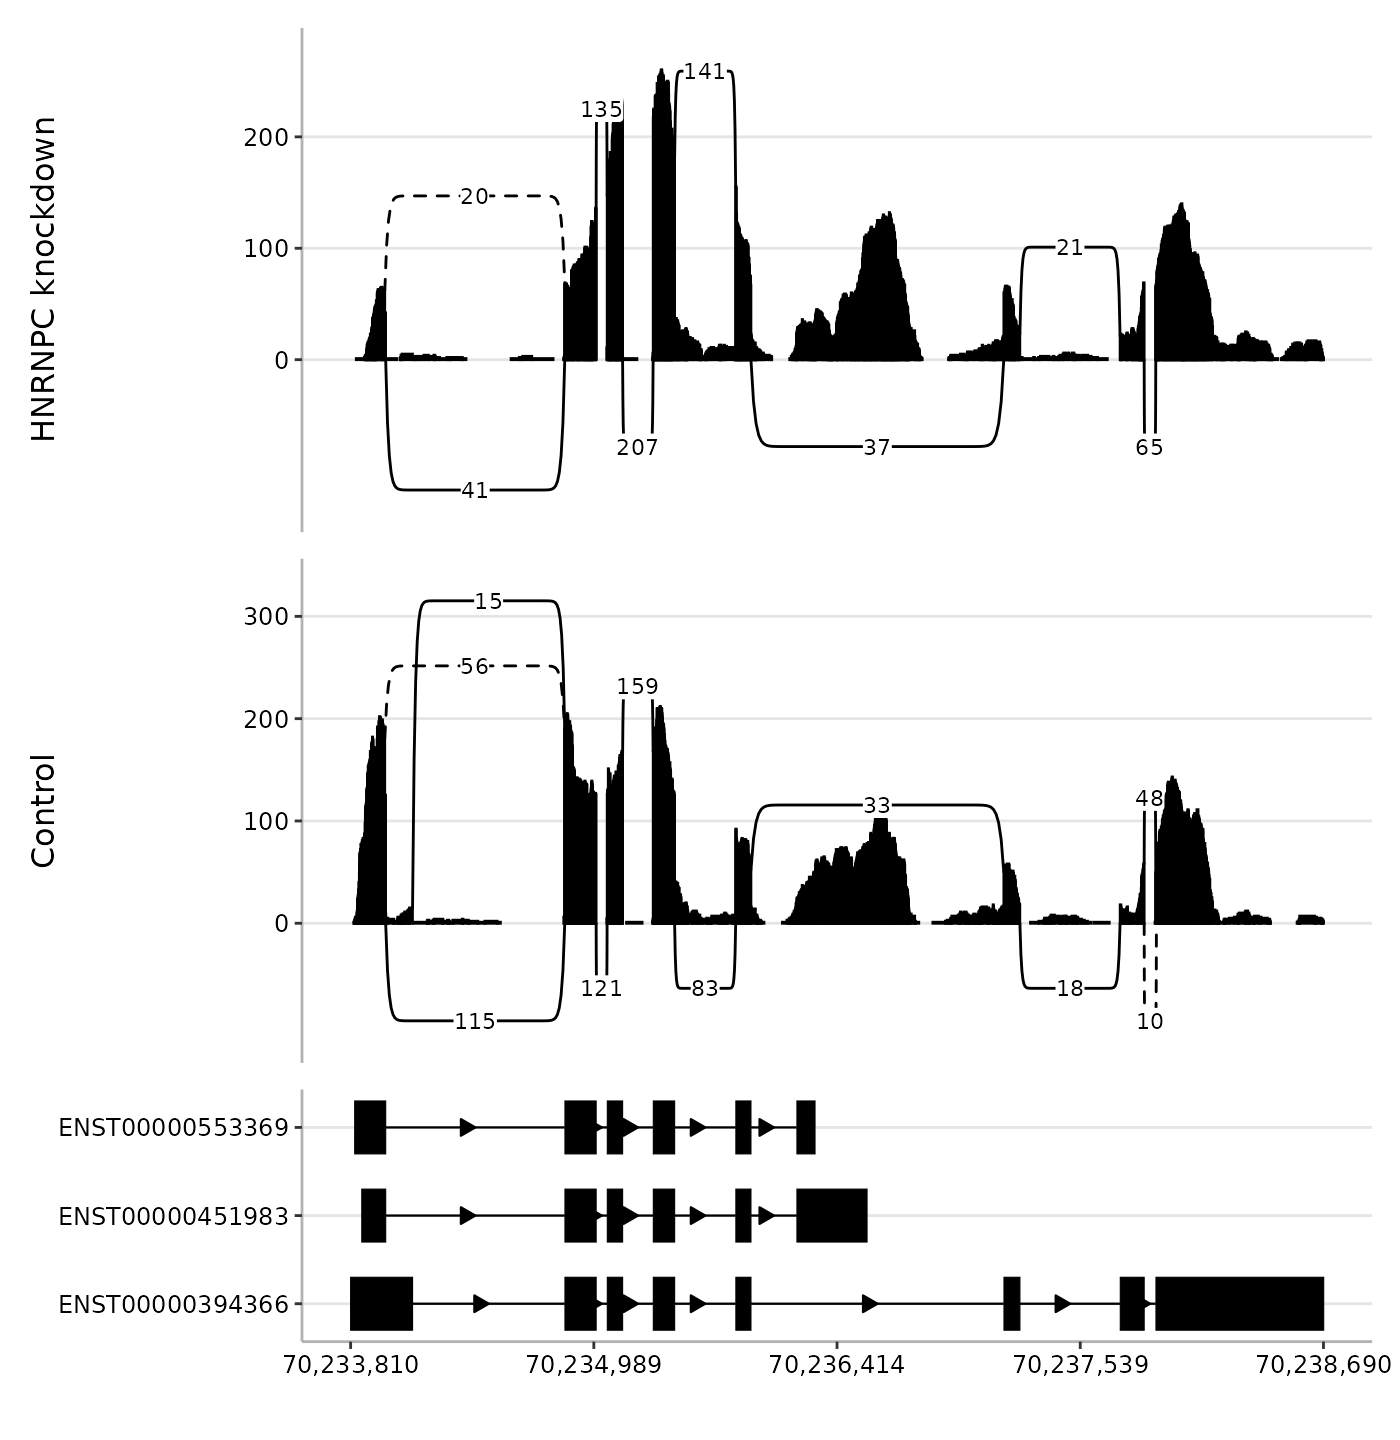
Transcript models can be displayed with the annotation
argument. This must be a GRangesList, where each list
element represents one transcript or feature group. The names of the
list elements are used as y-axis labels in the annotation panel. When
annotation is present, the final plot contains one panel per BAM file
plus one annotation panel. The relative heights of these panels are
controlled with panel_heights, where the final value
corresponds to the annotation panel. Setting
annotated_junctions = TRUE distinguishes junctions that
exactly match an intron in the supplied annotation with solid arcs,
while unmatched junctions are drawn with dashed arcs. Junction
classification is relative to the supplied annotation, so known
junctions may appear unmatched when only a subset of transcripts is
provided.
For this vignette, the plotting region covers the SRSF5 gene. We retrieve exon ranges for the gene and keep a small number of transcripts so the annotation panel remains readable.
annotation <- exonsBy(
    ensDb, by = "tx", filter = GeneIdFilter("ENSG00000100650")
)
annotation <- annotation[1:3]
seqlevelsStyle(annotation) <- "UCSC"
spliceTerrain(
    bam = bams,
    region = region,
    annotation = annotation,
    annotated_junctions = TRUE,
    panel_heights = c(2, 2, 1)
)
Styling annotation tracks
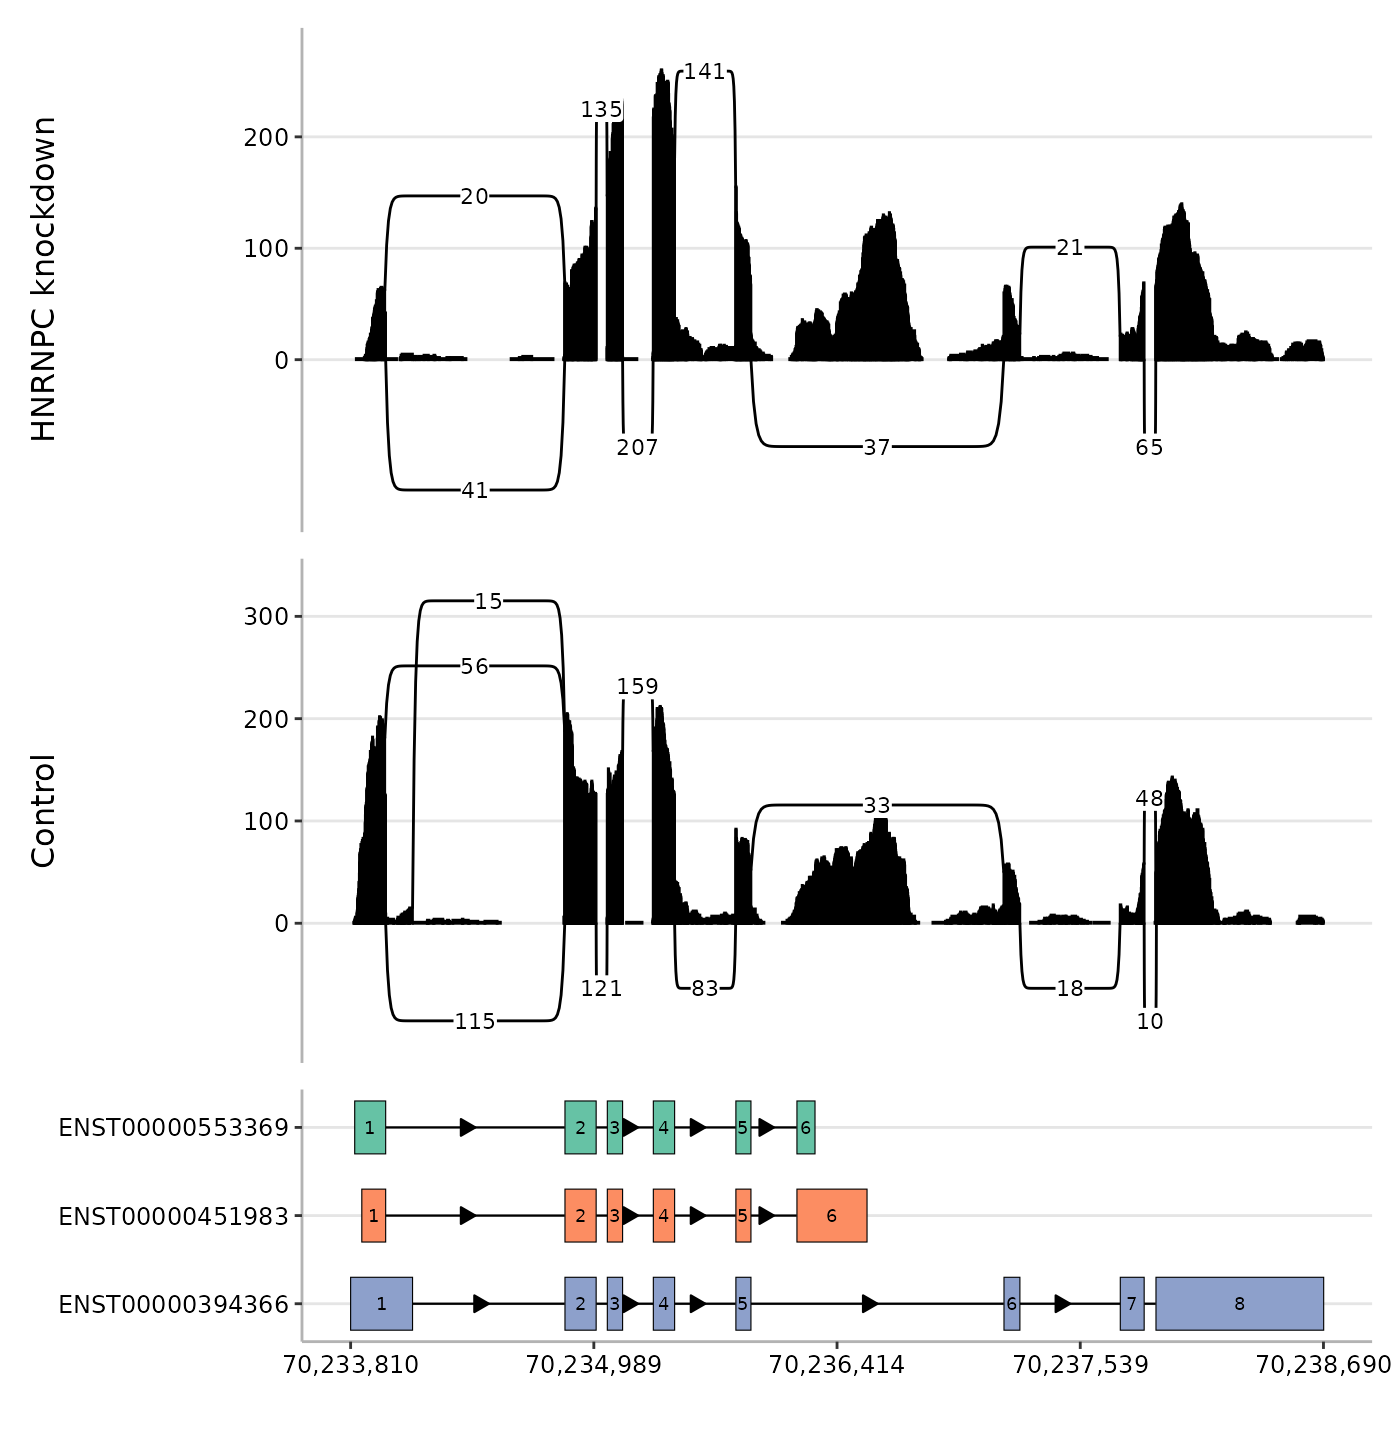
Annotation features can be coloured by a metadata column with
anno_fill_by. Use "group" to colour each
transcript or feature group separately. Specific fill colours can be
supplied with anno_fill_colours.
Text labels can be drawn inside annotation features with
anno_label_by. The label colour and size are controlled by
anno_label_colour and anno_label_size. The
min_arrow argument controls how wide an annotation intron
must be before directional arrows are drawn.
spliceTerrain(
    bam = bams,
    region = region,
    annotation = annotation,
    panel_heights = c(2, 2, 1),
    anno_fill_by = "group",
    anno_fill_colours = c(
        ENST00000553369 = "#66C2A5",
        ENST00000394366 = "#8DA0CB",
        ENST00000451983 = "#FC8D62"
    ),
    anno_label_by = "exon_rank",
    anno_label_colour = "black",
    anno_label_size = 2.5,
    min_arrow = 100
)
Highlighting regions of interest
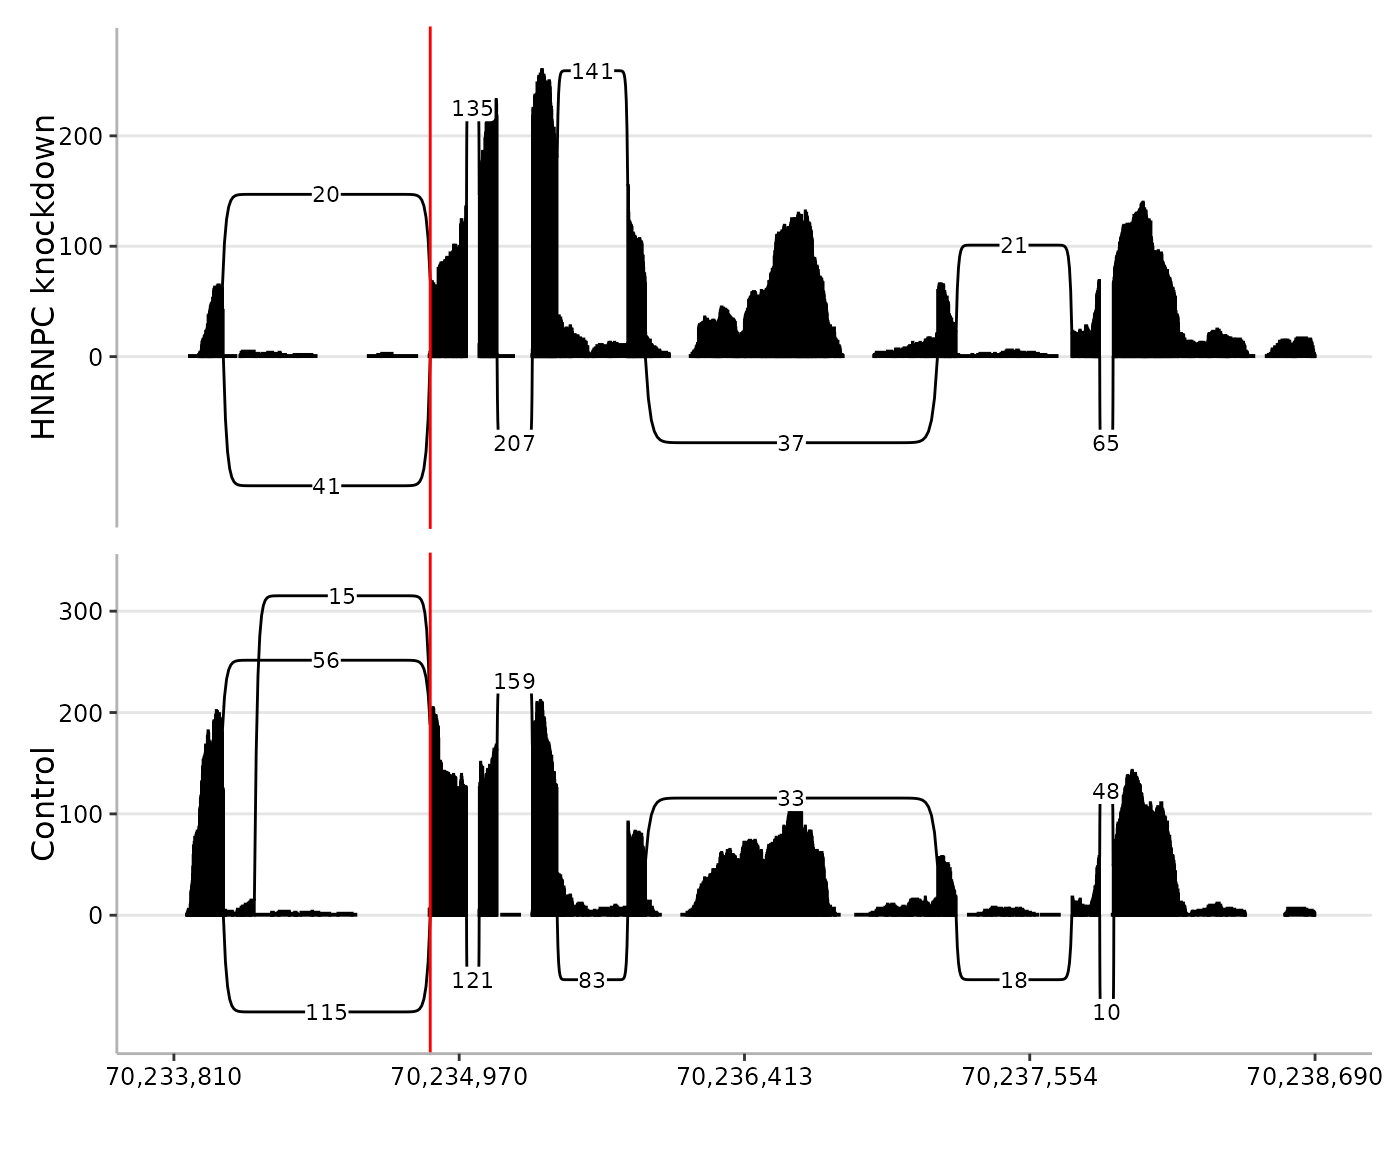
The highlight argument marks one or more genomic
intervals with shaded vertical bands. This is useful for drawing
attention to a splice site, variant position, alternative exon, or other
feature of interest. The highlighted interval can be supplied as a
character string or as a GRanges object.
spliceTerrain(
    bam = bams,
    region = region,
    highlight = "chr14:70234854-70234854",
    highlight_colour = "red"
)
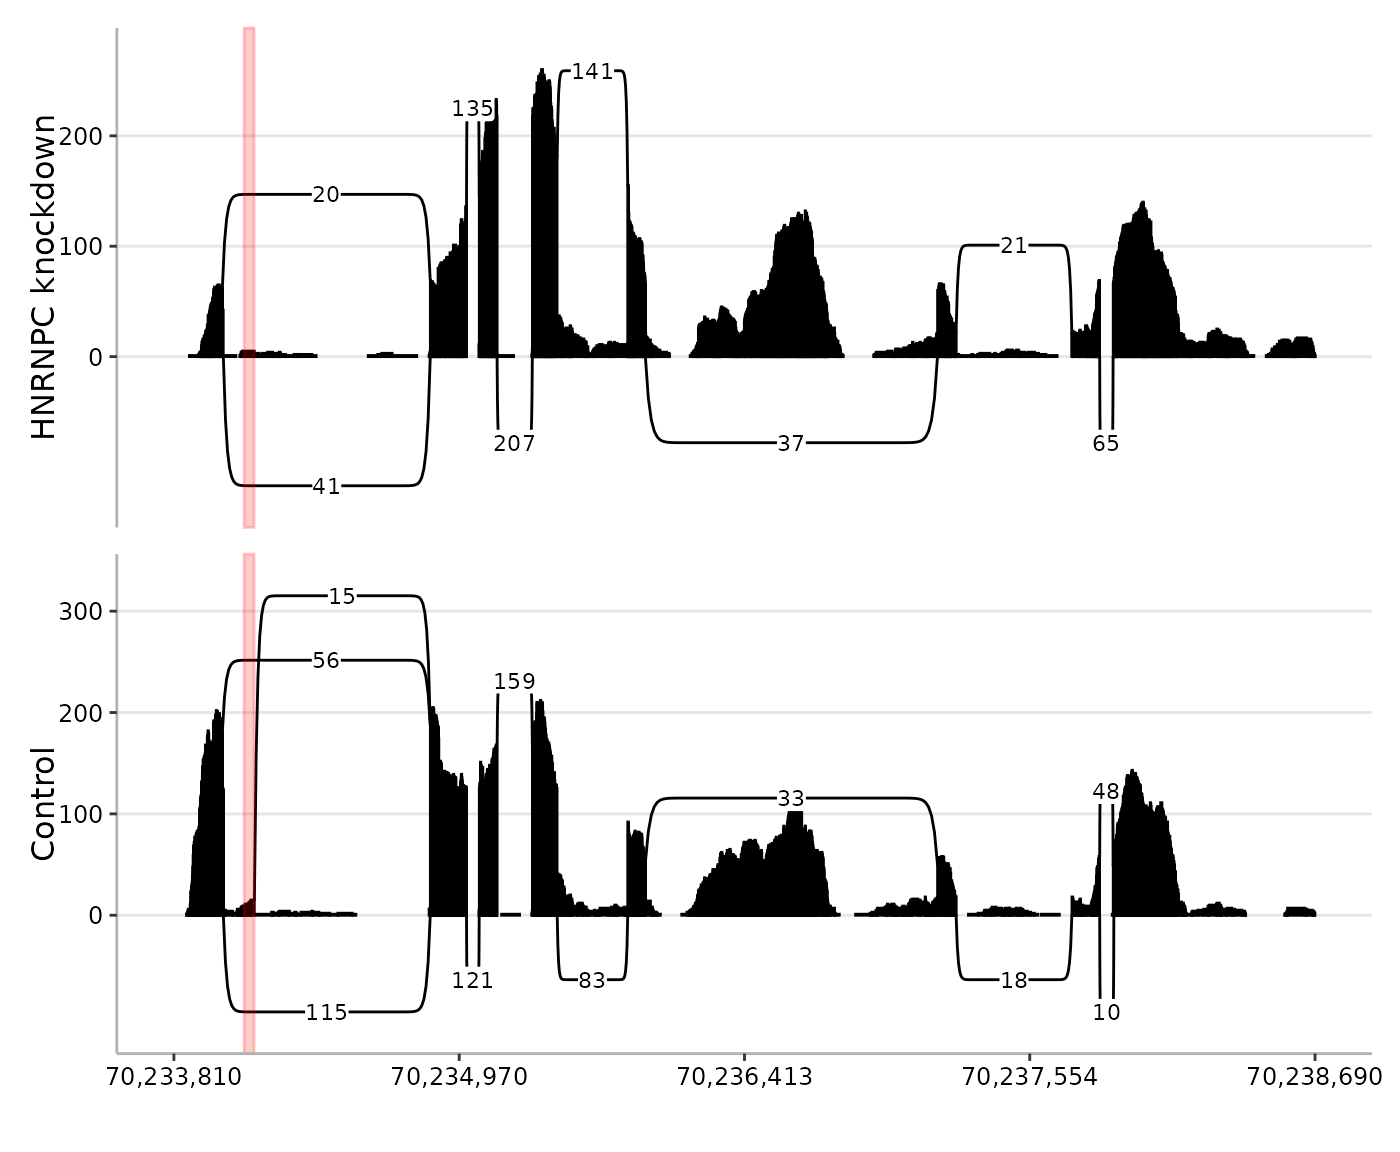
A wider interval can be highlighted with a semi-transparent colour.
spliceTerrain(
    bam = bams,
    region = region,
    highlight = "chr14:70234056-70234097",
    highlight_colour = scales::alpha("red", 0.2)
)
Local junction-usage labels
The junction_usage argument selects junctions by a
genomic position or range and labels their relative fragment support
within each sample. Junctions are selected when either their start or
end anchor overlaps the supplied interval(s). Junction anchors use
intronic coordinates: the start anchor is the first base of the intron,
and the end anchor is the last base of the intron, not the adjacent
exonic bases.
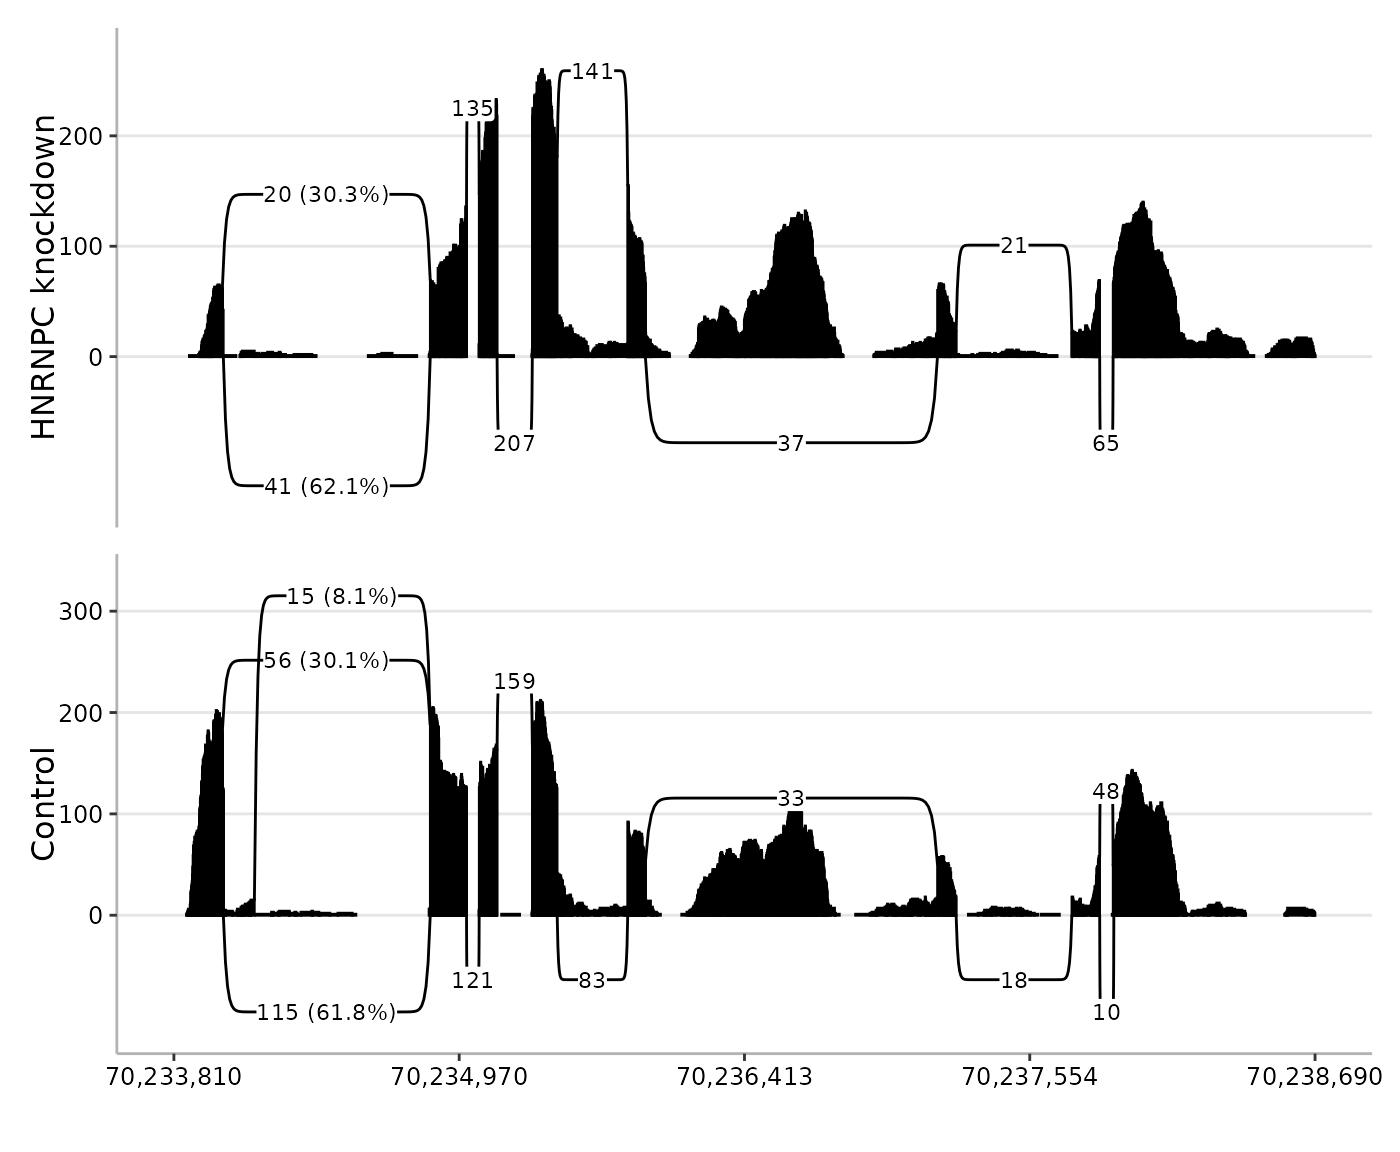
Selecting a single shared splice site gives the cleanest
interpretation. For junctions sharing a donor or acceptor, the
labels describe their relative support at that site. By default, the
junction count and usage percentage are separated by a new line. Use
junction_usage_label_sep = " " to display them together on
one line.
spliceTerrain(
    bam = bams,
    region = region,
    junction_usage = "chr14:70234854-70234854",
    junction_usage_label_sep = " "
)
A range can also be supplied, including one covering multiple splice sites. It defines a combined set of selected junctions; each junction enters the denominator once, even if both anchors or overlapping intervals select it.
spliceTerrain(
    bam = bams,
    region = region,
    junction_usage = "chr14:70234098-70234854"
)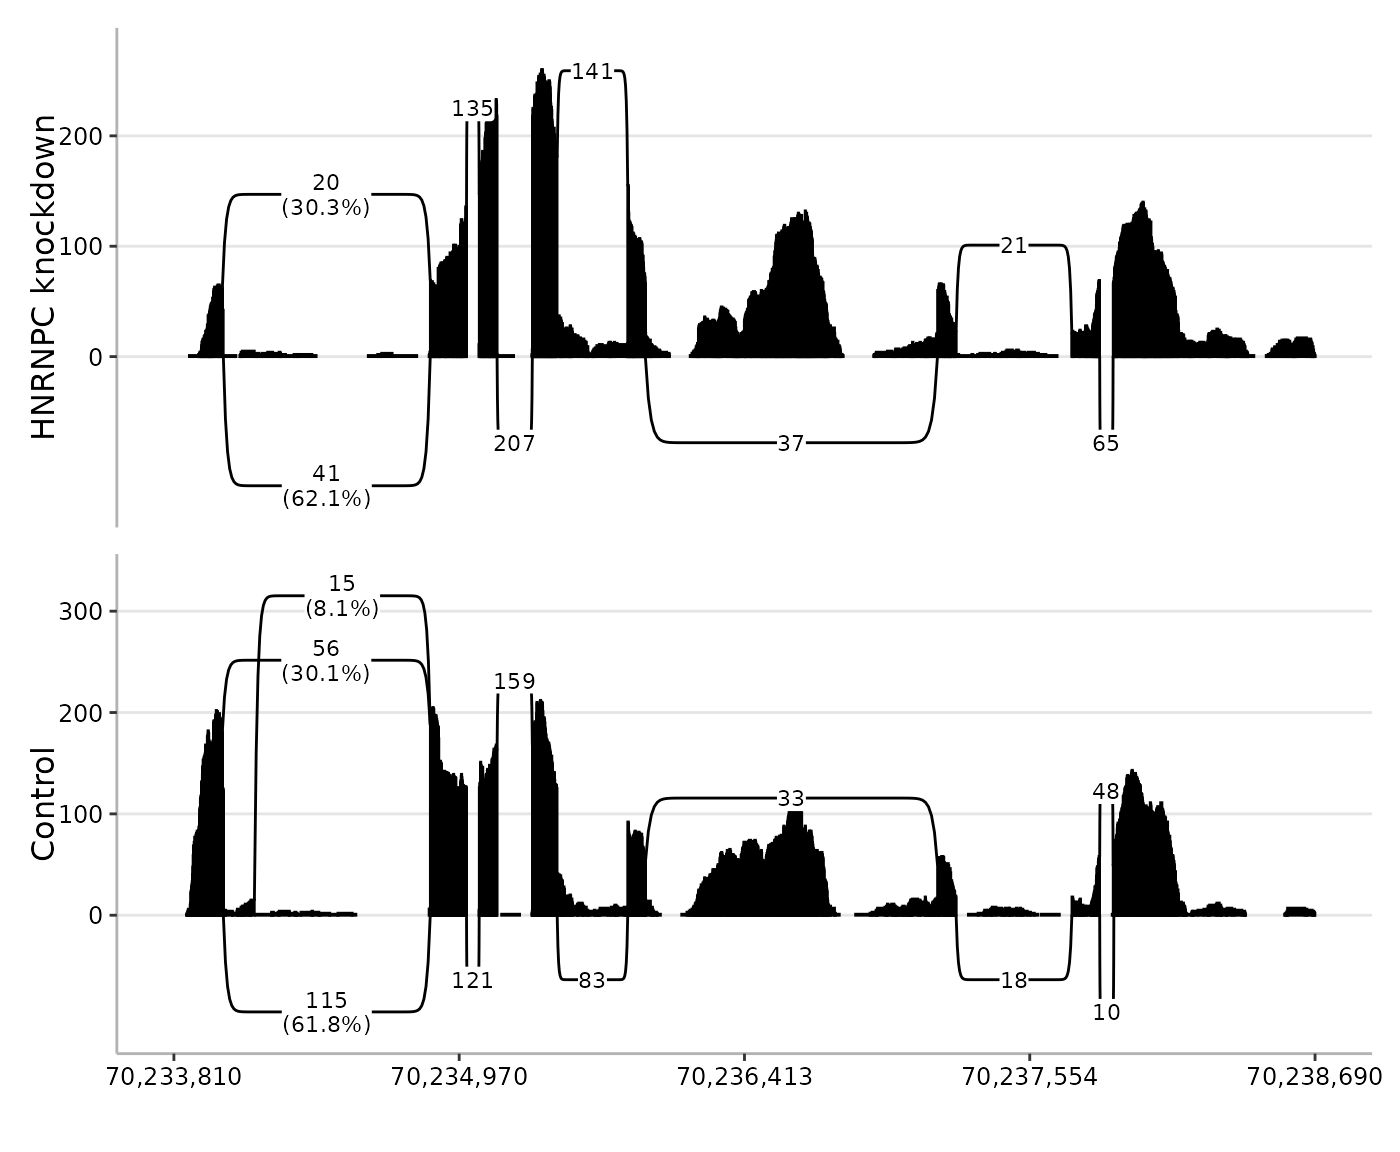
For each sample, the percentage is the junction’s raw fragment
support divided by the summed support of all selected, eligible imported
junctions. This is calculated after import, MAPQ, and strand filtering,
but before min_junction_reads filtering or plotting-window
exclusion. An alternative junction remains in the denominator when its
arc is hidden. For example, supports of 90 and 9 give 90.9% and 9.1%;
hiding the second arc with a threshold of 10 leaves the first label at
90.9%, not 100%. Visible percentages therefore need not sum to 100%.
Library-size normalisation does not change the fractions. The reference
is conditional on the imported data: changing the query region, MAPQ
threshold, or strand selection can change the available evidence.
Why this is not event-level PSI
Consider a cassette exon between an upstream and a downstream exon. In a simplified example, 50 inclusion fragments support both inclusion junctions, and 50 skipping fragments support the direct skipping junction. A range selecting all three junctions gives the following junction-usage labels:
cassette <- data.frame(
    Junction = c("Upstream inclusion", "Downstream inclusion", "Skipping"),
    Fragments = c(50L, 50L, 50L)
)
cassette[["Junction usage (%)"]] <- round(
    100 * cassette$Fragments / sum(cassette$Fragments), 1
)
pander(cassette)| Junction | Fragments | Junction usage (%) |
|---|---|---|
| Upstream inclusion | 50 | 33.3 |
| Downstream inclusion | 50 | 33.3 |
| Skipping | 50 | 33.3 |
The denominator is 150 units of junction support, so each label is 33.3%. There are only 100 fragments in this constructed example, with a known exon inclusion fraction of 50%: each inclusion fragment supports two junctions. Thus the 33.3% labels are not estimates of the cassette exon’s inclusion. Selecting one shared donor or acceptor instead compares one inclusion junction with the skipping junction and gives 50% for each in this example. Ranges remain useful for inspecting broader patterns, but their combined junction fractions should not be interpreted as general event-level percent spliced in (PSI) or transcript-isoform proportions.
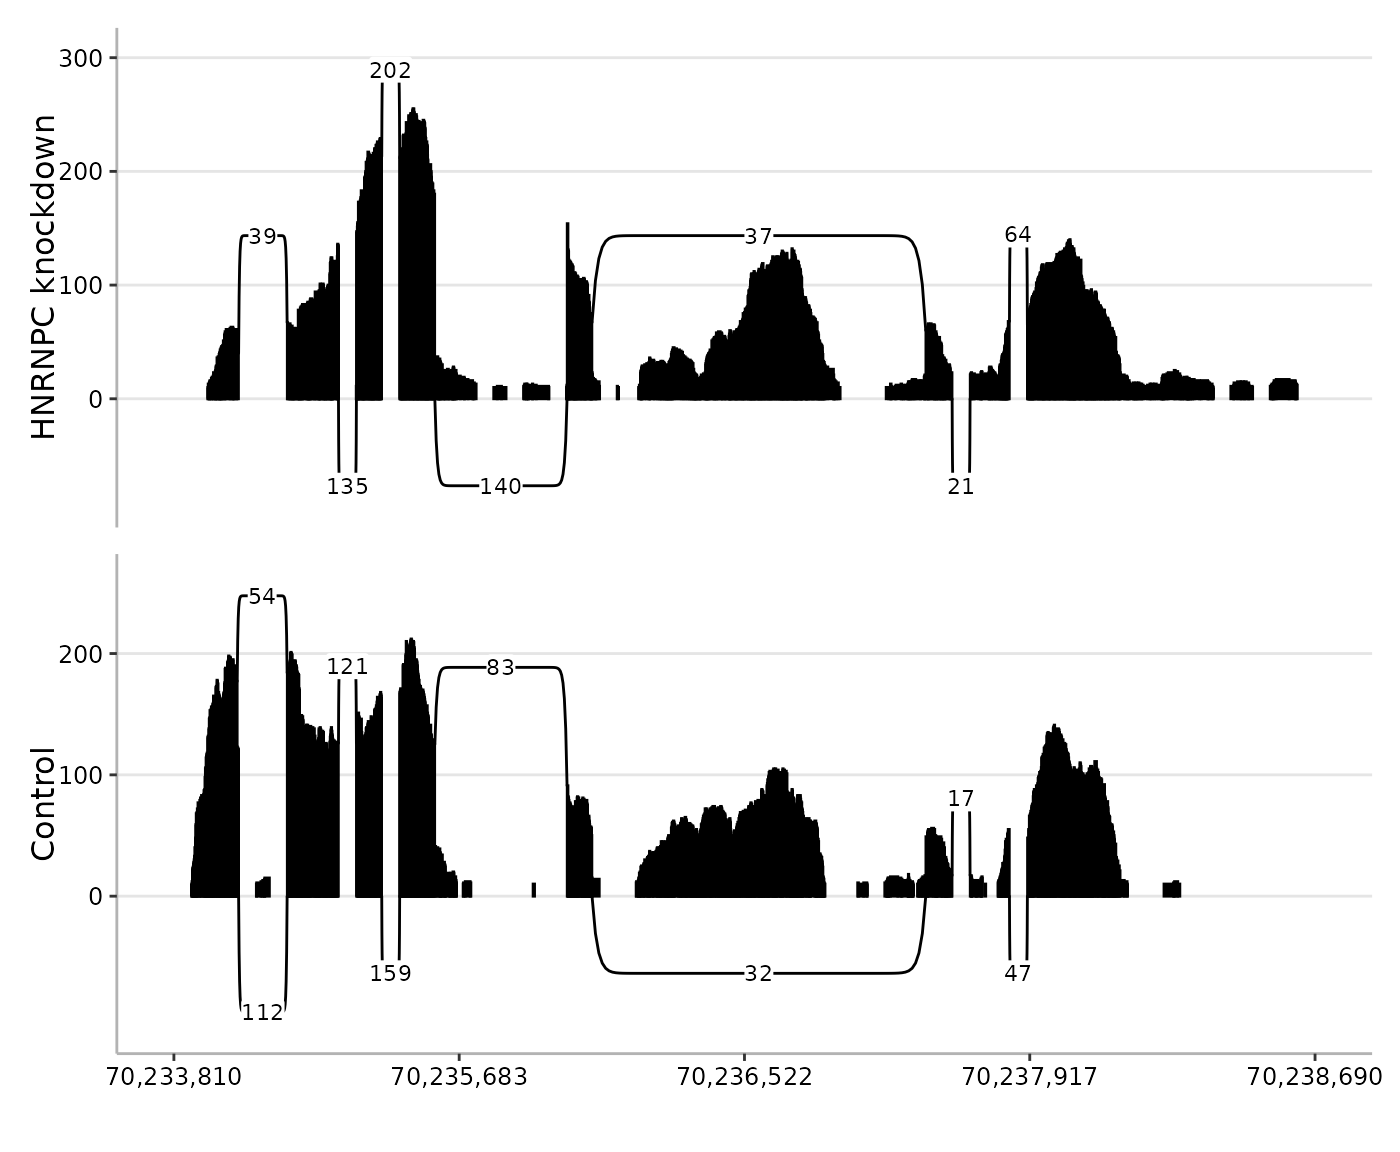
Filtering signal
Three arguments control how much signal is imported and displayed.
min_mapq filters alignments by mapping quality during BAM
import. min_coverage filters positions by per-base fragment
coverage before plotting. min_junction_reads sets the
minimum fragment support required to display a junction arc. Both mates
supporting the same junction contribute one count. Both thresholds are
applied to raw fragment counts before library-size normalisation. The
latter two arguments also accept percentage strings such as
"10%". Percentage thresholds are calculated separately for
each BAM relative to its maximum raw coverage or junction count within
the plotting region. When supplying one threshold per BAM, whole-number
counts and percentages can be mixed in a character vector.
spliceTerrain(
    bam = bams,
    region = region,
    min_mapq = 10,
    min_coverage = 10,
    min_junction_reads = "10%"
)
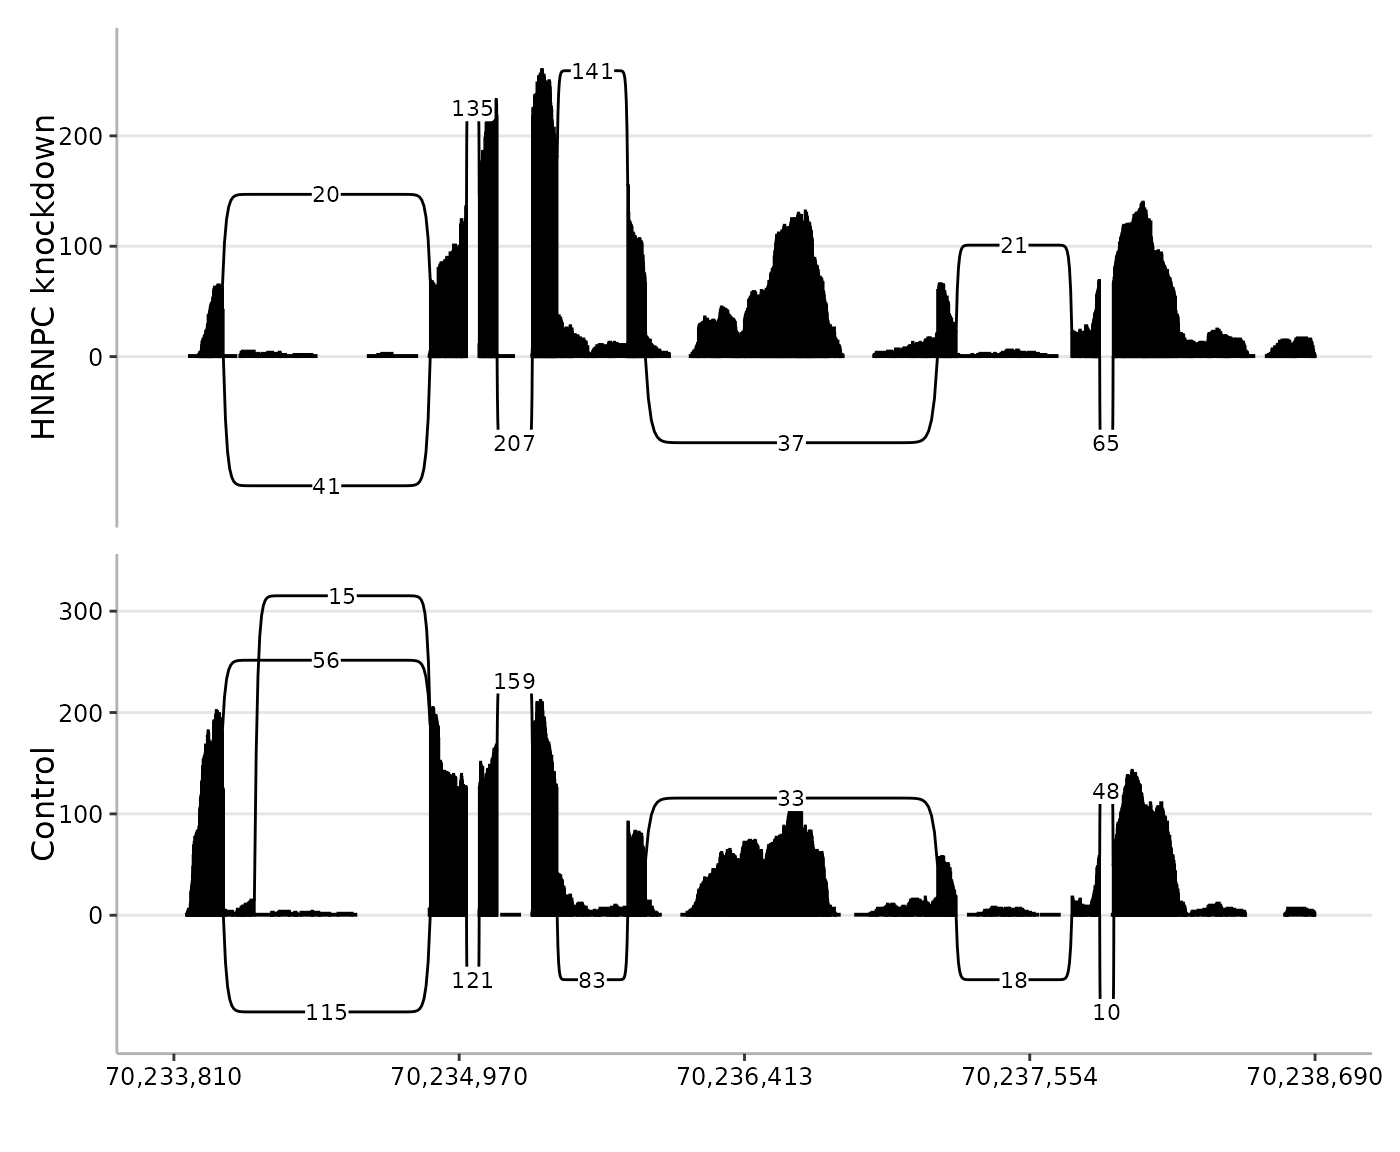
Stranded RNA-seq data
The strandedness argument describes how read strand
should be interpreted. It can be one of "unstranded",
"forward", or "reverse", and can be supplied
either as a single value for all BAM files or one value per BAM file.
The example BAM files are unstranded, so both read orientations contain
signal from the transcript.
spliceTerrain(
    bam = bams,
    region = region,
    strandedness = "unstranded"
)
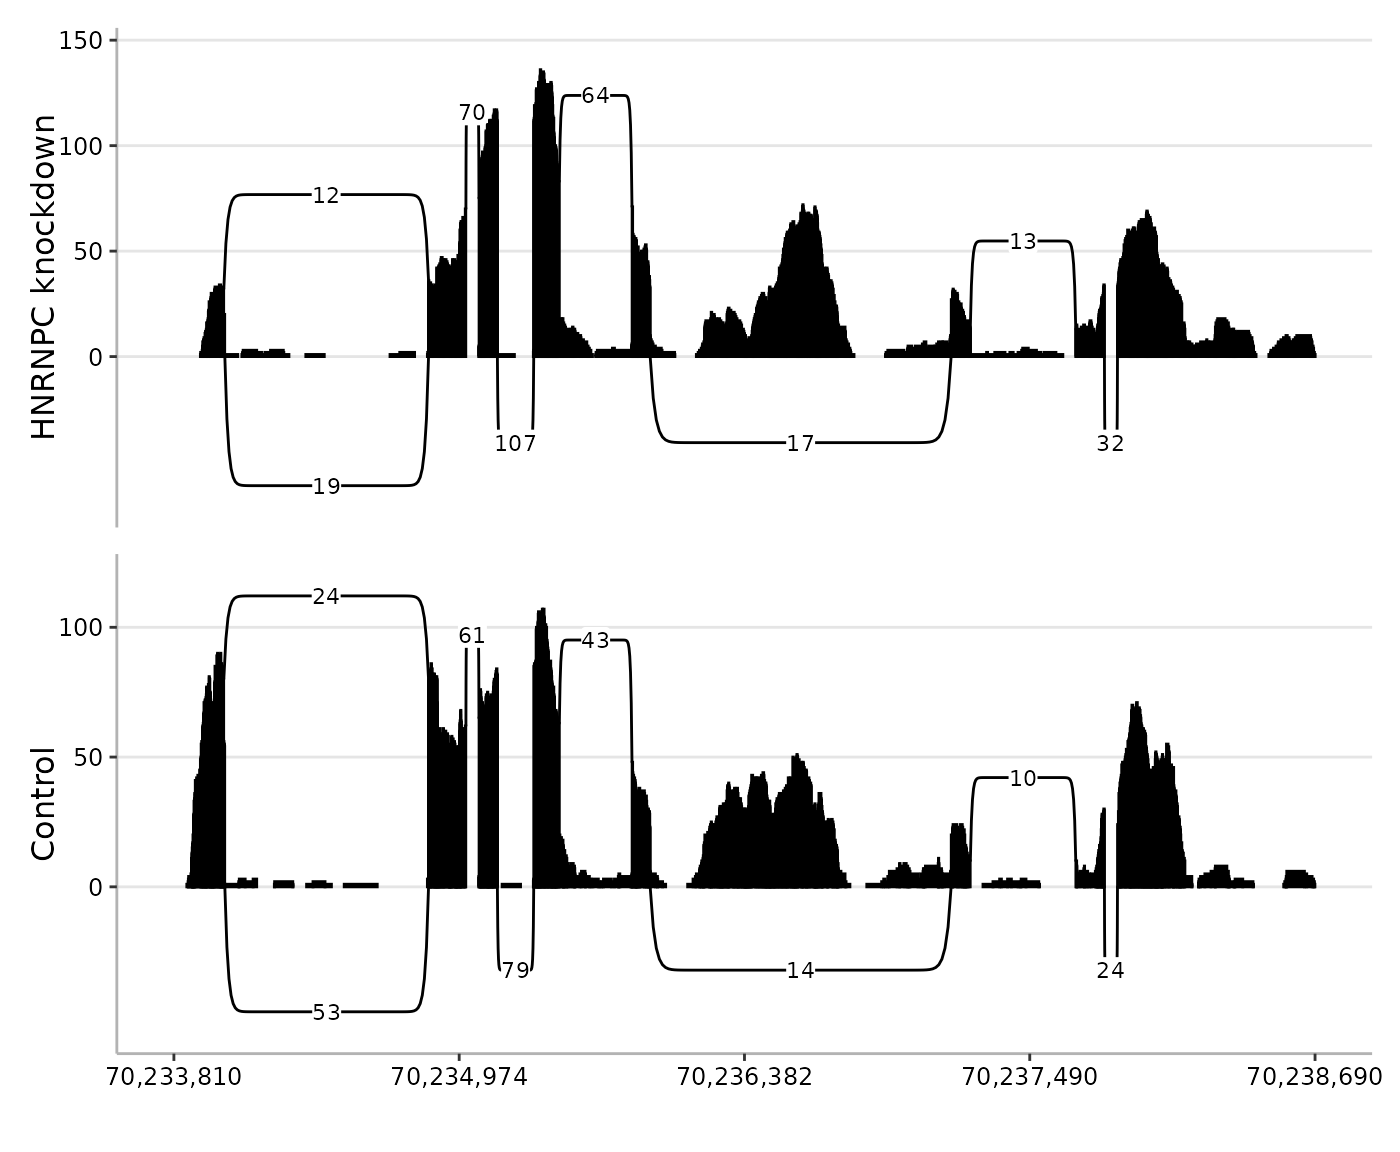
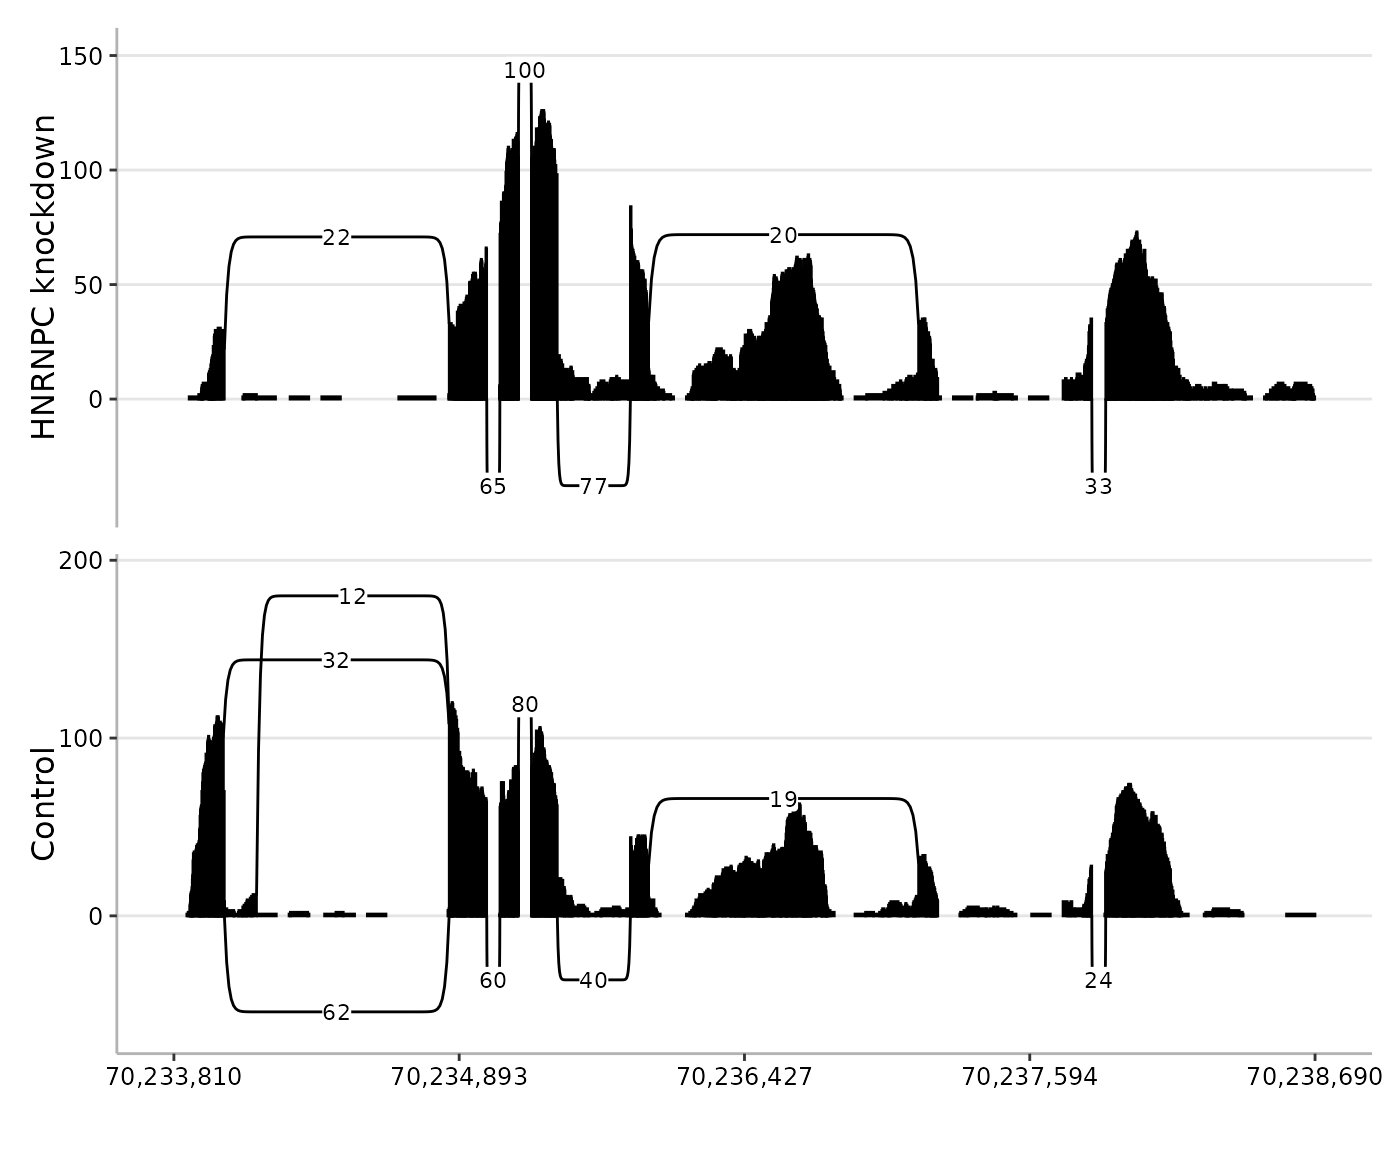
Specifying a stranded protocol for unstranded BAM files filters reads
by strand. As a result, either "reverse" or
"forward" shows only part of the coverage that is visible
when strandedness = "unstranded".
spliceTerrain(
    bam = bams,
    region = region,
    strandedness = "forward"
)
spliceTerrain(
    bam = bams,
    region = region,
    strandedness = "reverse"
)
For paired-end BAM files, spliceTerrain() detects
paired-end status from the BAM alignment flags and imports alignments
accordingly. Mapped reads are retained even when their mates are
unmapped. Read-one/read-two flags determine strand interpretation for
both complete pairs and singletons. Unmapped, secondary, supplementary,
and below-min_mapq alignments are excluded. If
region specifies a strand and strandedness is
not "unstranded", alignments are restricted to the resolved
region strand.
Coverage and junction support are fragment-level summaries. Each imported mate group, mapped singleton, or single-end read is one fragment. Coverage uses the union of each fragment’s aligned blocks. Overlapping mates contribute at most one count per covered position. Introns and unsequenced gaps between mates remain uncovered. Each fragment supports a distinct junction at most once, even if both mates cross it.
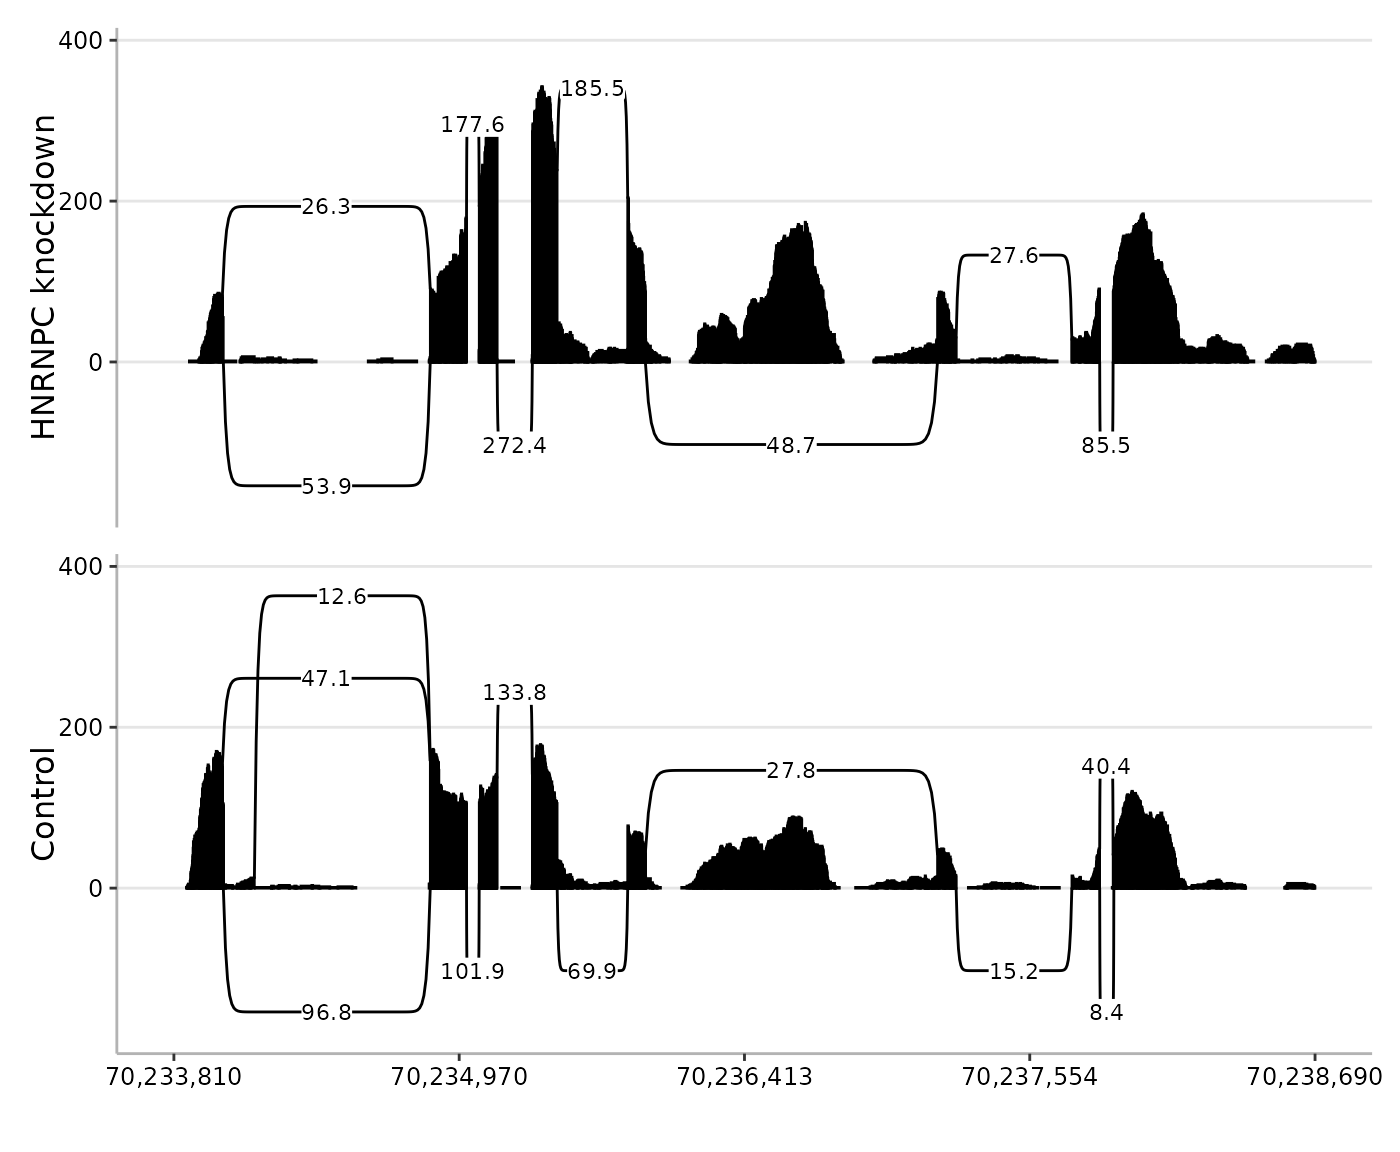
Normalising between samples
When samples have different sequencing depths, coverage and junction
counts can be normalised with lib_size. Supply full-library
sizes in fragment units before restriction to the plotting region: one
per pair or mapped singleton, or one per read for single-end data.
Additional normalisation factors, such as trimmed mean of M-values (TMM)
factors (Robinson and Oshlack 2010)
estimated with edgeR, can be supplied with
norm_factors. The effective library size is calculated as
lib_size * norm_factors.
By default, counts are normalised to the median effective library
size. Use normalise_to to set the target explicitly. The
common_y argument is useful when comparing samples because
it puts sample panels on the same y-axis scale.
spliceTerrain(
    bam = bams,
    region = region,
    lib_size = c(40e6, 55e6),
    norm_factors = c(0.95, 1.08),
    normalise_to = 50e6,
    common_y = TRUE
)
Compressed genomic layouts
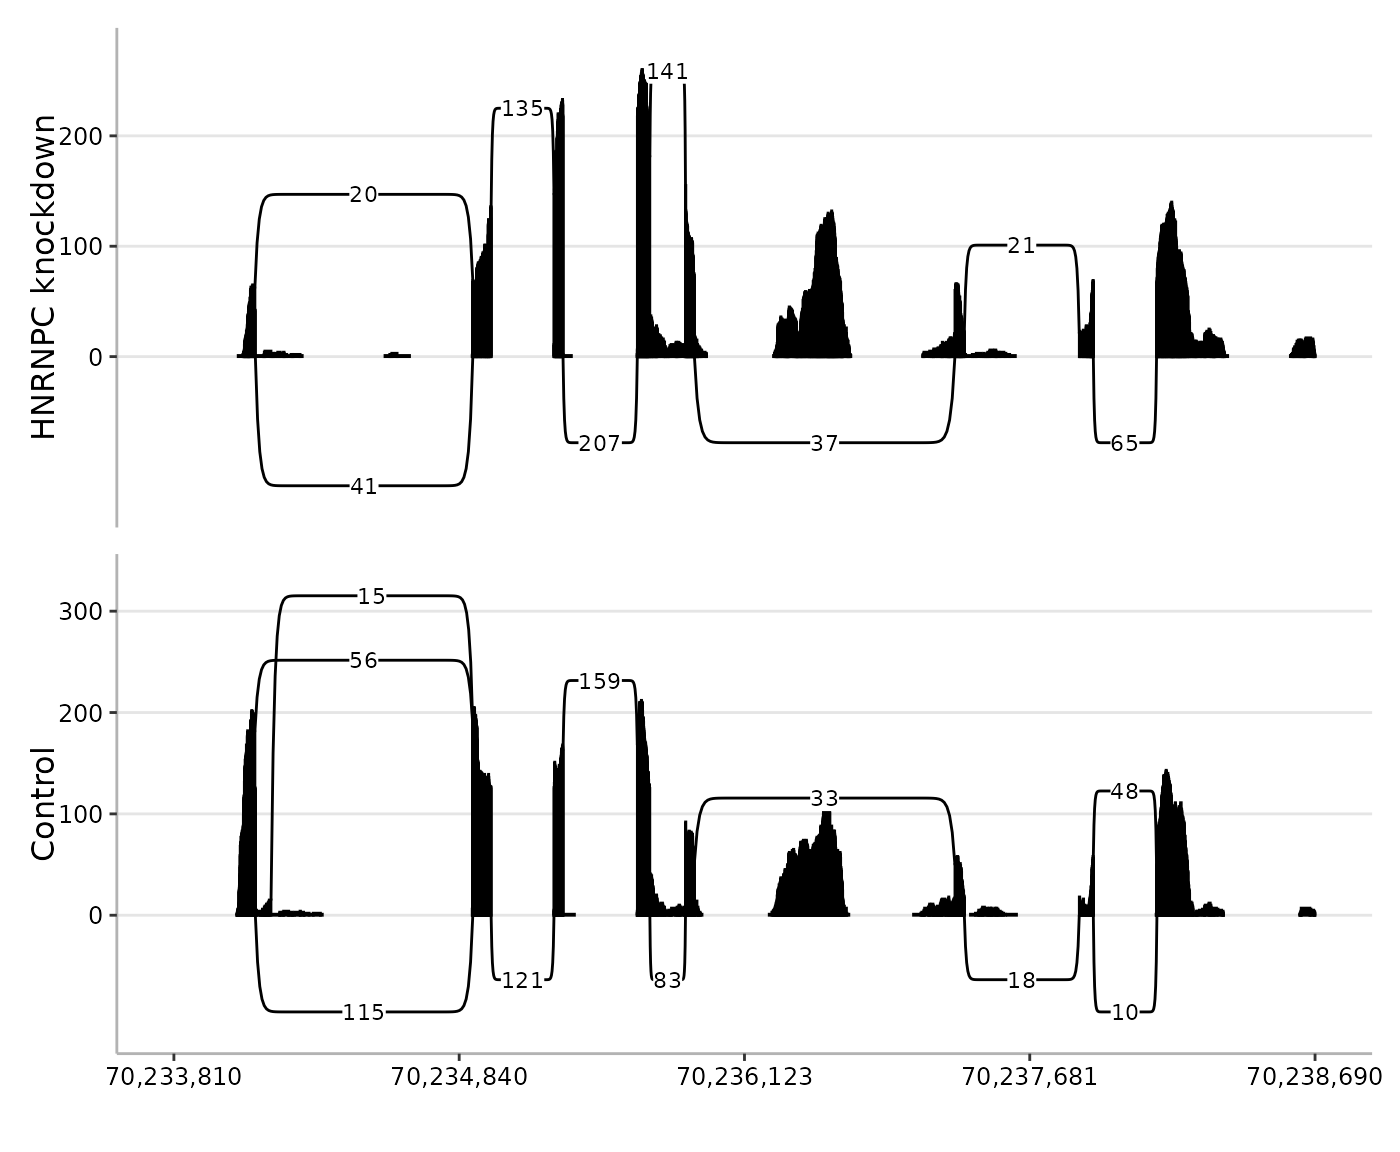
By default, compress_introns = TRUE compacts large
uninformative gaps so the plot focuses on observed signal. The
intron_width argument controls the approximate width of
compacted introns in plot space. The map is built jointly from retained
coverage across samples, annotations, and junction/selection anchors.
Retained blocks keep their widths; gaps between them receive the chosen
width. Consequently, retained intronic coverage or an unannotated
covered exon remains part of the displayed signal rather than being
compressed simply because it lies inside an annotated intron. Changing
coverage filters can change the retained blocks and their map.
spliceTerrain(
    bam = bams,
    region = region,
    compress_introns = TRUE,
    intron_width = 500
)
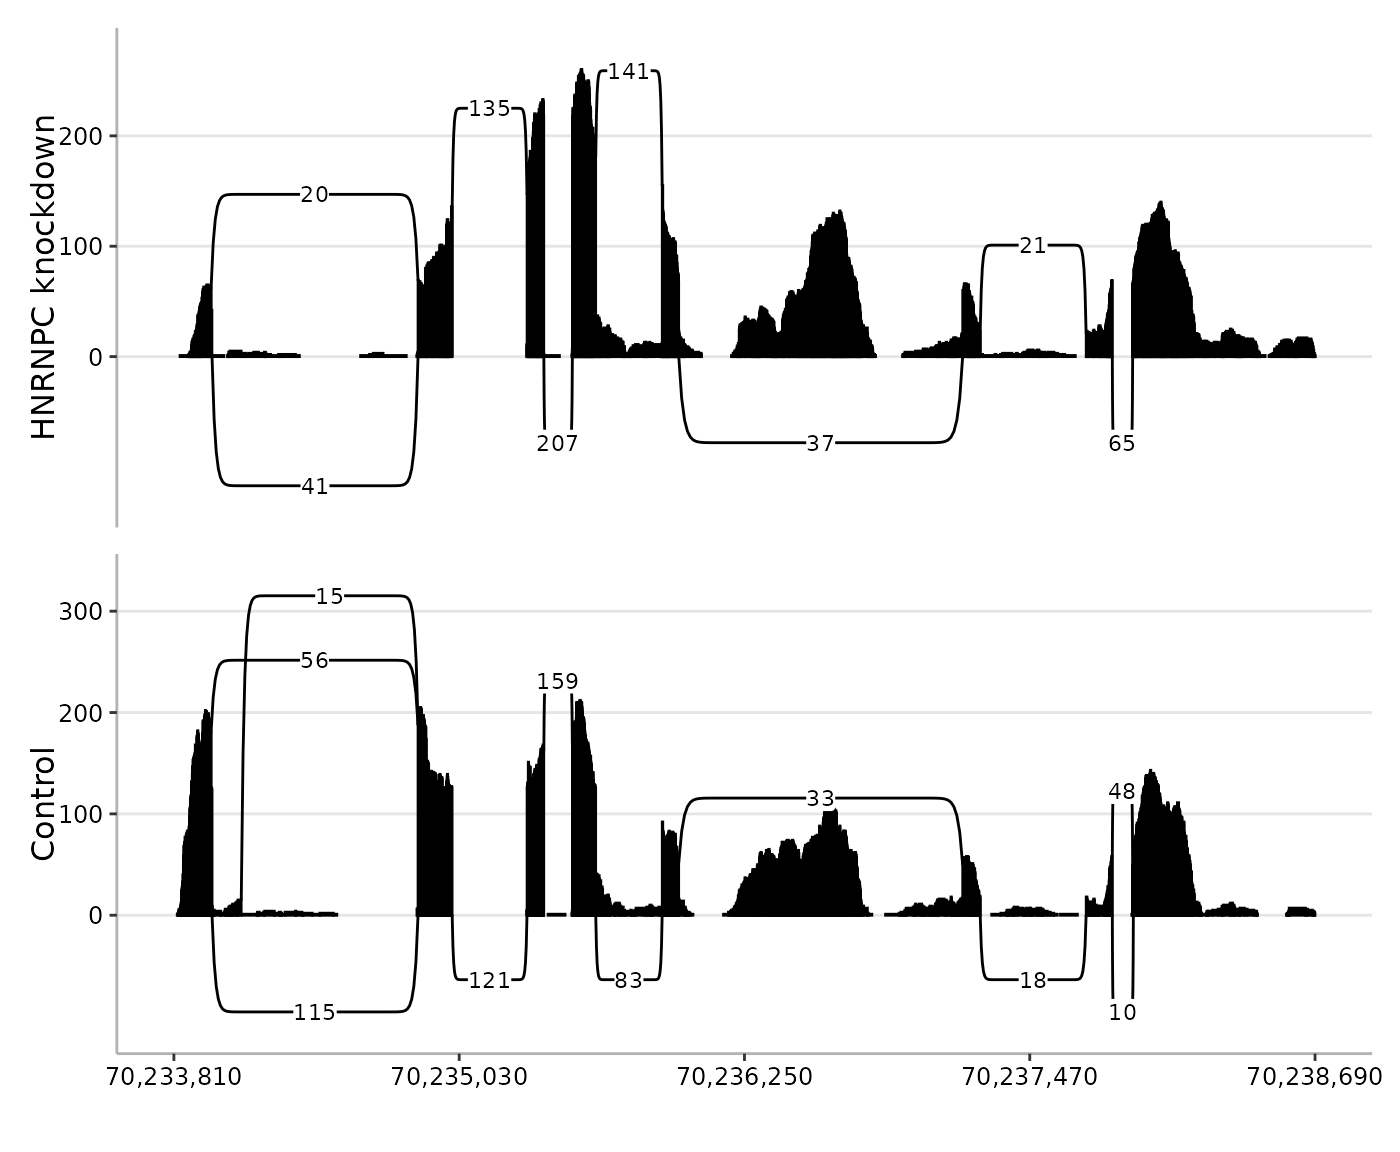
If exact genomic distances are more important than compact display, intron compression can be disabled.
spliceTerrain(
    bam = bams,
    region = region,
    compress_introns = FALSE
)
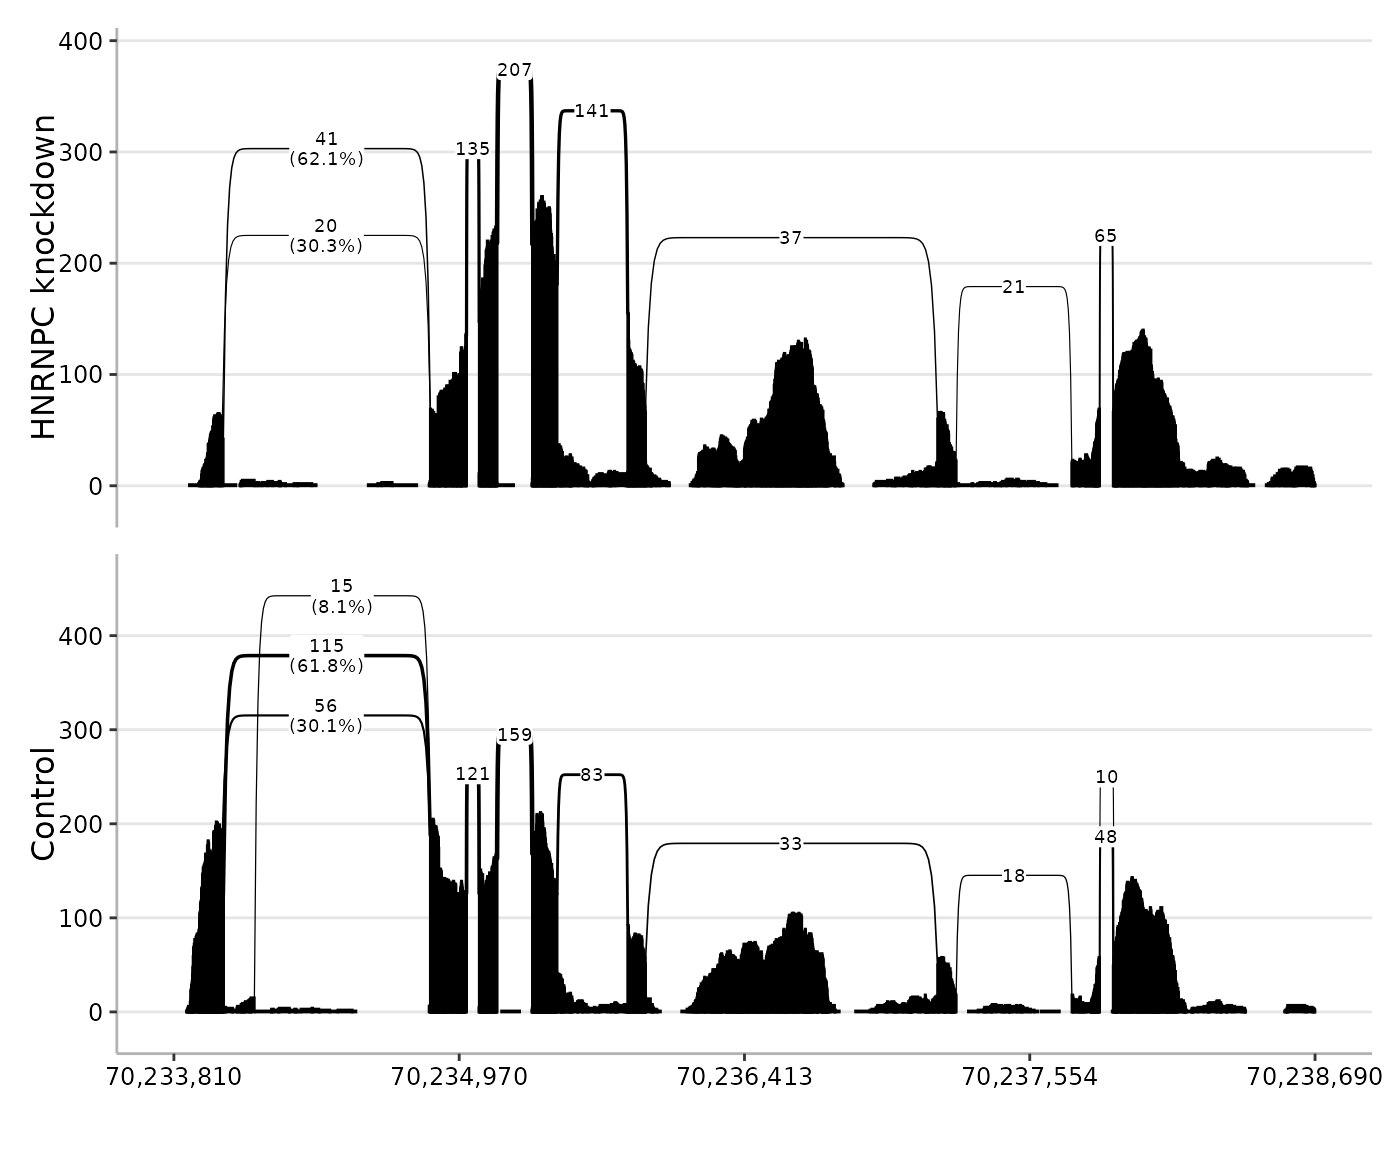
Junction arc display
Junction arcs can be tuned with arc_height,
arc_side, and arc_scale. Increasing
arc_height gives stacked arcs more vertical separation. The
arc_side argument controls whether arcs are drawn above,
below, or on both sides of the coverage track. With
arc_scale = TRUE, arc width scales with filtered fragment
support. Junction label size is controlled with
junc_text_size.
spliceTerrain(
    bam = bams,
    region = region,
    junction_usage = "chr14:70234854-70234854",
    arc_height = 2,
    arc_side = "above",
    arc_scale = TRUE,
    junc_text_size = 2.5
)
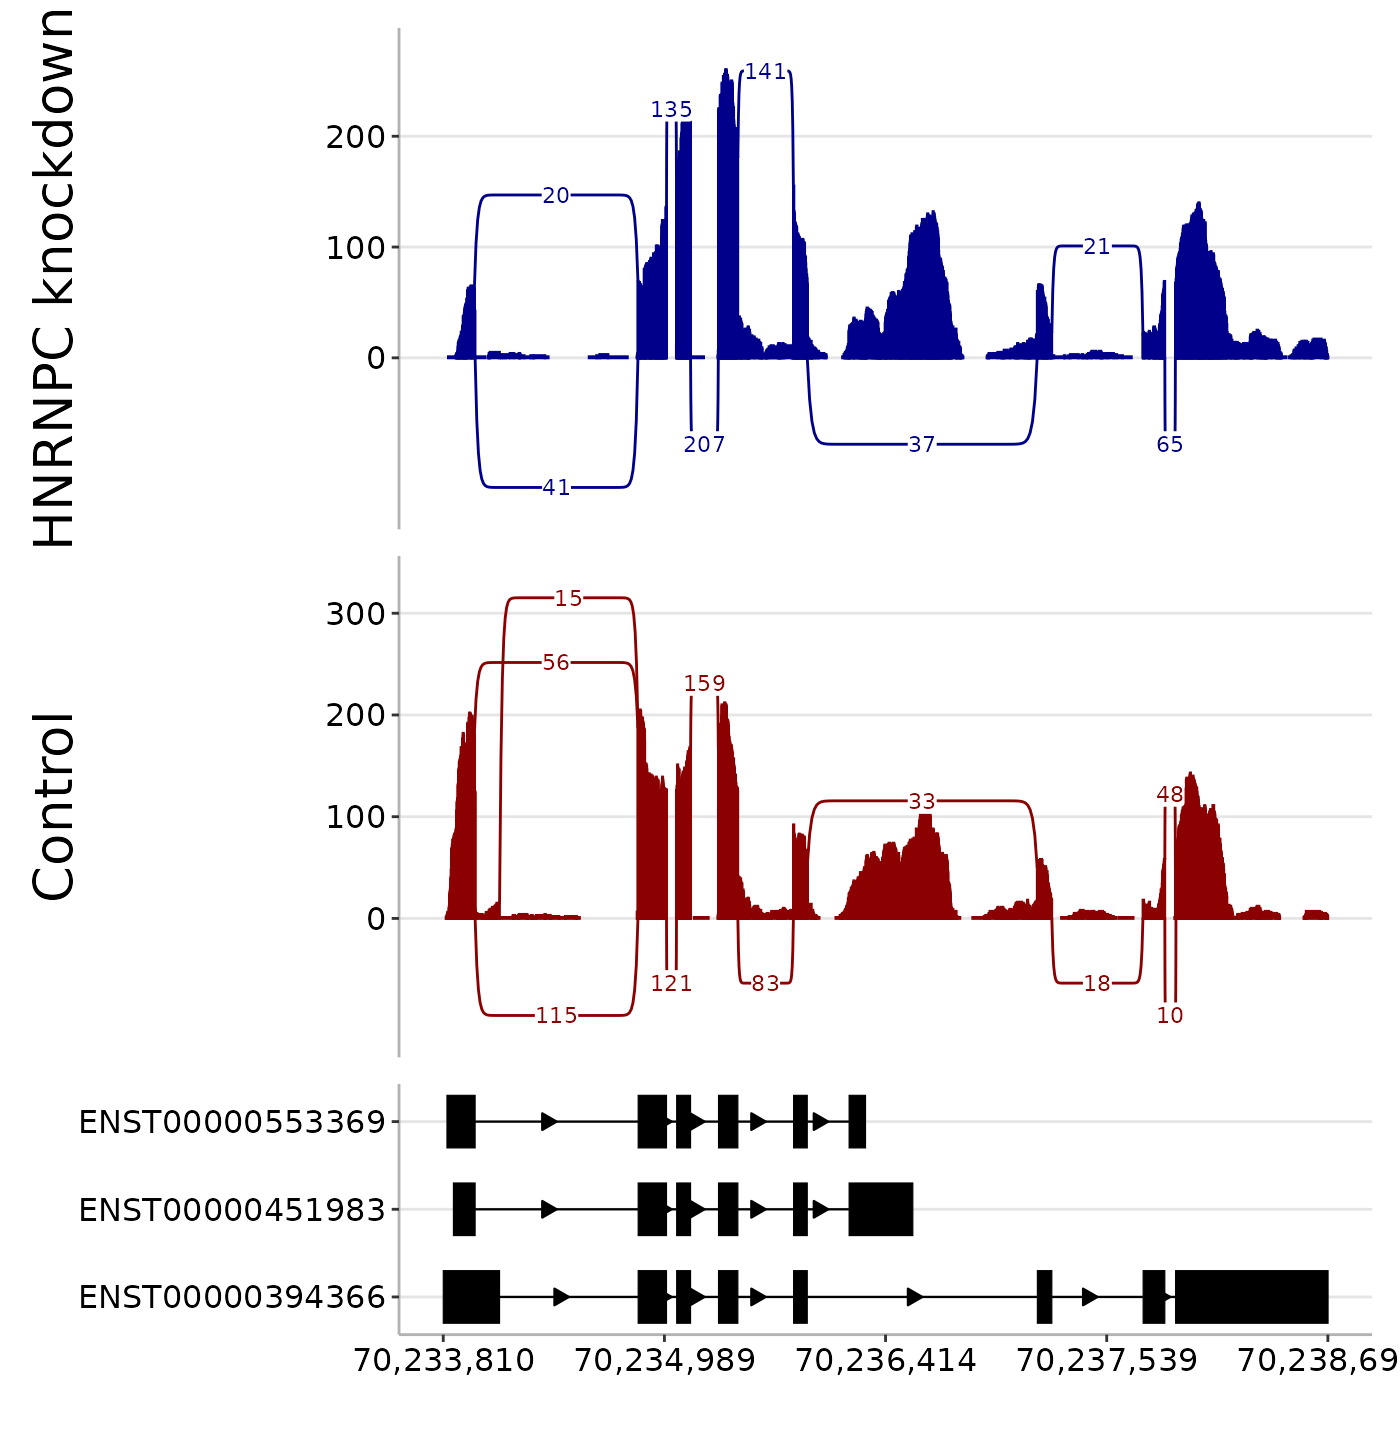
Sample colours and panel layout
The colours argument controls the colours used for
sample coverage and junction arcs. It can be a single colour used for
all samples or one colour per BAM file.
Axis text sizes can be adjusted with axis_title_size and
axis_text_size.
spliceTerrain(
    bam = bams,
    region = region,
    annotation = annotation,
    colours = c("darkblue", "darkred"),
    panel_heights = c(2, 2, 1),
    axis_title_size = 20,
    axis_text_size = 12
)
Returning and reusing plot data
Most users can work directly with the final plot returned by
spliceTerrain(). For advanced workflows, set
return_ctx = TRUE to return the processed context instead.
This contains validated settings, imported alignments, summarised
coverage, junction counts, annotation, and overlays. The
gal field contains one alignment object per sample:
GAlignments for single-end BAMs or
GAlignmentsList for paired-end BAMs. The paired-end list
groups imported mates and includes mapped singleton reads. The
cov and juncs fields contain fragment
summaries: coverage_raw holds unnormalised fragment counts
and coverage holds the plotting values after any
library-size normalisation. The juncs_all field retains
eligible junction summaries on the plotting chromosome before display
filtering or clipping, including out-of-window junctions from imported
alignments. It provides a stable reference for the
usage_fraction column in juncs. That column is
on the 0–1 scale, with NA for unselected junctions or an
undefined percentage. All coordinate-bearing fields use genomic
coordinates; compressed plot coordinates are generated internally only
when the context is plotted.
The context also supports programmatic inspection, including AI-assisted workflows. Scripts or AI agents working within an R session can inspect coverage and junction summaries, check the values underlying plotted labels, and modify annotations or plotting settings before redrawing the figure. This provides access to the data behind the visualisation without requiring those values to be inferred from the plot image.
ctx <- spliceTerrain(
    bam = bams,
    region = region,
    annotation = annotation,
    min_junction_reads = 1,
    panel_heights = c(2, 2, 1),
    min_arrow = 100,
    return_ctx = TRUE
)

names(ctx)
#>  [1] "bam"                      "region"                   "annotation"               "junction_usage"           "junction_usage_label_sep" "highlight"                "strandedness"             "min_mapq"                 "min_coverage"             "min_junction_reads"       "lib_size"                 "norm_factors"             "normalise_to"             "compress_introns"         "intron_width"             "min_arrow"                "common_y"                 "arc_height"               "arc_side"                 "arc_scale"                "colours"                  "highlight_colour"         "anno_fill_by"             "anno_fill_colours"        "anno_label_by"            "anno_label_colour"        "anno_label_size"          "junc_text_size"           "panel_heights"            "axis_title_size"          "axis_text_size"           "annotated_junctions"      "gal"                      "cov"                      "juncs"                    "juncs_all"
The context can be passed back with the ctx argument to
redraw the plot without re-importing BAM files or recalculating coverage
and junctions. For example, the annotation can be used to retain only
coverage overlapping annotated exons and junctions that exactly match
annotated introns.
ctx$cov <- ctx$cov[overlapsAny(ctx$cov, ctx$annotation)]
ctx$juncs <- ctx$juncs[ctx$juncs$annotation_match]
spliceTerrain(ctx = ctx)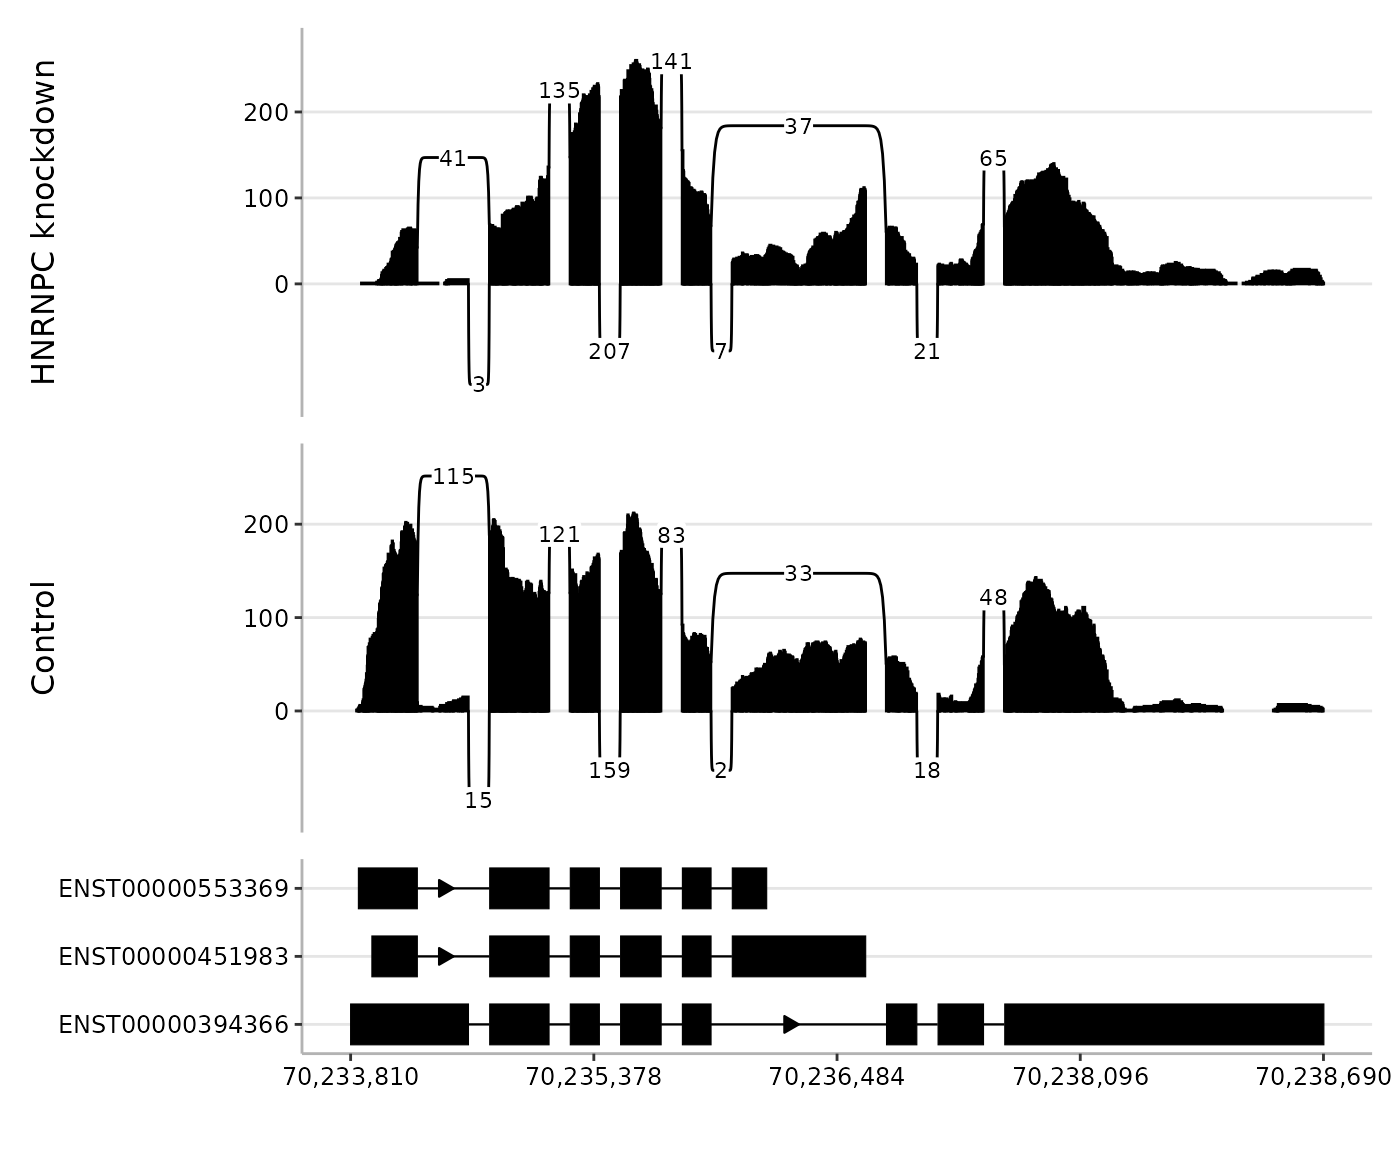
The annotation_match field records whether each junction
exactly matches an intron implied by the supplied annotation. Plotting
settings can also be changed directly, for example with
ctx$colours <- c("darkblue", "darkred"). Settings that
control BAM import, filtering, or normalisation are not reapplied when a
context is replotted because its coverage and junctions are already
processed.
Filtering ctx$juncs changes which arcs are displayed
without changing the usage denominator. Changing
ctx$junction_usage to another GRanges
selection recalculates the fractions from ctx$juncs_all
when plotting. If you intend to change the reference evidence itself,
edit ctx$juncs_all, retaining one row per
sample/junction.
Session information
sessionInfo() |>
    pander()
R Under development (unstable) (2026-11-03 r90835)
Platform: x86_64-pc-linux-gnu
locale: LC_CTYPE=C.UTF-8, LC_NUMERIC=C, LC_TIME=C.UTF-8, LC_COLLATE=C.UTF-8, LC_MONETARY=C.UTF-8, LC_MESSAGES=C.UTF-8, LC_PAPER=C.UTF-8, LC_NAME=C, LC_ADDRESS=C, LC_TELEPHONE=C, LC_MEASUREMENT=C.UTF-8 and LC_IDENTIFICATION=C
attached base packages: stats4, stats, graphics, grDevices, utils, datasets, methods and base
other attached packages: GenomeInfoDb(v.1.48.0), pander(v.0.6.6), scales(v.1.4.0), EnsDb.Hsapiens.v75(v.2.99.0), ensembldb(v.2.36.1), AnnotationFilter(v.1.36.0), GenomicFeatures(v.1.64.0), AnnotationDbi(v.1.74.0), Biobase(v.2.72.0), GenomicRanges(v.1.64.0), Seqinfo(v.1.2.0), IRanges(v.2.46.0), S4Vectors(v.0.50.3), BiocGenerics(v.0.58.1), generics(v.0.1.4), RNAseqData.HNRNPC.bam.chr14(v.0.50.0), spliceTerrain(v.0.99.0) and BiocStyle(v.2.40.0)
loaded via a namespace (and not attached): farver(v.2.1.2), blob(v.1.3.0), Biostrings(v.2.80.2), S7(v.0.2.2), bitops(v.1.1-0), fastmap(v.1.2.0), RCurl(v.1.98-1.20), lazyeval(v.0.2.3), GenomicAlignments(v.1.48.0), XML(v.3.99-0.25), digest(v.0.6.39), lifecycle(v.1.0.5), ProtGenerics(v.1.44.0), KEGGREST(v.1.52.2), RSQLite(v.3.53.3), compiler(v.4.7.0), rlang(v.1.3.0), sass(v.0.4.10), tools(v.4.7.0), yaml(v.2.3.12), rtracklayer(v.1.72.0), knitr(v.1.52), labeling(v.0.4.3), S4Arrays(v.1.12.1), bit(v.4.6.0), curl(v.8.1.0), DelayedArray(v.0.38.2), RColorBrewer(v.1.1-3), abind(v.1.4-8), BiocParallel(v.1.46.0), withr(v.3.0.3), desc(v.1.4.3), grid(v.4.7.0), ggplot2(v.4.0.3), SummarizedExperiment(v.1.42.0), cli(v.3.6.6), rmarkdown(v.2.32), crayon(v.1.5.3), ragg(v.1.5.2), otel(v.0.2.0), httr(v.1.4.9), rjson(v.0.2.23), DBI(v.1.3.0), cachem(v.1.1.0), parallel(v.4.7.0), BiocManager(v.1.30.27), XVector(v.0.52.0), restfulr(v.0.0.17), matrixStats(v.1.5.0), vctrs(v.0.7.3), Matrix(v.1.7-6), jsonlite(v.2.0.0), bookdown(v.0.48), patchwork(v.1.3.2), bit64(v.4.8.6), systemfonts(v.1.3.2), jquerylib(v.0.1.4), glue(v.1.8.1), pkgdown(v.2.2.1), codetools(v.0.2-20), gtable(v.0.3.6), BiocIO(v.1.22.0), UCSC.utils(v.1.8.0), htmltools(v.0.5.9), R6(v.2.6.1), textshaping(v.1.0.5), evaluate(v.1.0.5), lattice(v.0.23-1), png(v.0.1-9), Rsamtools(v.2.28.0), cigarillo(v.1.2.1), memoise(v.2.0.1), bslib(v.0.12.0), Rcpp(v.1.1.2), SparseArray(v.1.12.3), xfun(v.0.62), pkgconfig(v.2.0.3), fs(v.2.1.0) and MatrixGenerics(v.1.24.0)